
[转载]Flash 报表之 CandlestickChart & ColumnChart – 情缘 – 博客园.
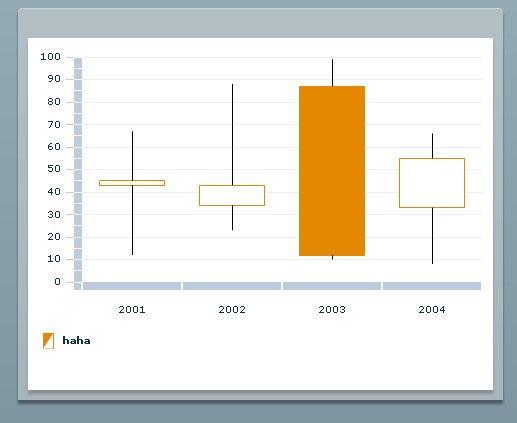
1.CandlestickChart 显示金融数据为一系列的蜡烛图,其体现高低开关的相关数值。每个图像的垂直线上的上顶点和下地点代表了每个数据点的高低数值,填充盒子的上顶和下底分别代表开发和关闭的数值。
2. CandlestickChart 的使用代码

 代码
代码
1 <mx:Application xmlns:mx=“http://www.adobe.com/2006/mxml“ layout=“absolute“>
2 <mx:Script>
3 <![CDATA[
4 import mx.collections.ArrayCollection;
5
6 public var scores:ArrayCollection=new ArrayCollection([
7 {date:“2001“,open:43,close:45,hight:67,low:12},
8 {date:“2002“,open:34,close:43,hight:88,low:23},
9 {date:“2003“,open:87,close:12,hight:99,low:10},
10 {date:“2004“,open:33,close:55,hight:66,low:8}
11 ]);
12
13 ]]>
14 </mx:Script>
15 <mx:Panel x=“98“ y=“40“ width=“485“ height=“392“ layout=“absolute“>
16 <mx:CandlestickChart x=“10“ y=“10“ id=“myCandleChart“ height=“271“ width=“445“ dataProvider=“{scores}“ showDataTips=“true“>
17 <mx:horizontalAxis>
18 <mx:CategoryAxis dataProvider=“{scores}“ categoryField=“date“/>
19 </mx:horizontalAxis>
20 <mx:series>
21 <mx:CandlestickSeries displayName=“haha“ openField=“open“ closeField=“close“ highField=“hight“ lowField=“low“/>
22 </mx:series>
23 </mx:CandlestickChart>
24 <mx:Legend dataProvider=“{myCandleChart}“ x=“10“ y=“289“ width=“445“/>
25
26 </mx:Panel>
27 </mx:Application>
3. CandlestickChart 的相关属性
closeField 定义关闭的y坐标数值,确定了图像的上顶和下底
highField 定义元素高的y坐标数值,确定图像的中线的上顶
lowField 定义了低的y坐标数值,确定图像中线的下底
openField 定义了元素打开y坐标的数值,确定了图像的上顶和下底
xField 定义图像在x轴坐标的每个数值
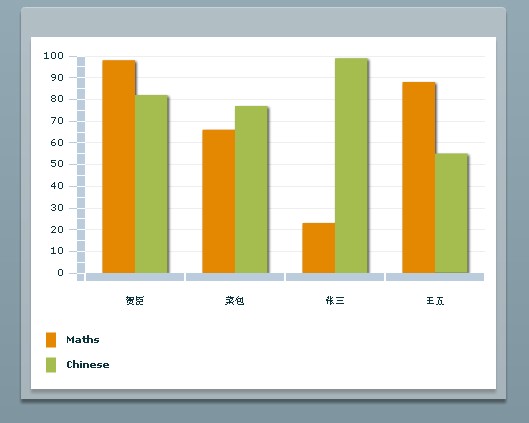
4.ColumnChart 显示一系列圆柱体,其高度有数据值来确定。
5. ColumnChart 使用代码
代码
1 <mx:Application xmlns:mx=“http://www.adobe.com/2006/mxml“ layout=“absolute“>
2 <mx:Script>
3 <![CDATA[
4 import mx.collections.ArrayCollection;
5
6 public var scores:ArrayCollection=new ArrayCollection([
7 {id:1,name:“贺臣“,Maths:98,Chinese:82},
8 {id:2,name:“菜包“,Maths:66,Chinese:77},
9 {id:3,name:“张三“,Maths:23,Chinese:99},
10 {id:4,name:“王五“,Maths:88,Chinese:55}
11 ]);
12
13 ]]>
14 </mx:Script>
15 <mx:Panel x=“98“ y=“40“ width=“485“ height=“392“ layout=“absolute“>
16 <mx:ColumnChart x=“10“ y=“10“ id=“myColumnChart“ showDataTips=“true“ dataProvider=“{scores}“ height=“263“ width=“445“>
17 <mx:horizontalAxis>
18 <mx:CategoryAxis dataProvider=“{scores}“ categoryField=“name“/>
19 </mx:horizontalAxis>
20 <mx:series>
21 <mx:ColumnSeries xField=“name“ displayName=“Maths“ yField=“Maths“/>
22 <mx:ColumnSeries xField=“name“ displayName=“Chinese“ yField=“Chinese“/>
23 </mx:series>
24 </mx:ColumnChart>
25 <mx:Legend dataProvider=“{myColumnChart}“ x=“10“ y=“289“ width=“445“/>
26
27 </mx:Panel>
28 </mx:Application>
6. ColumnChart 属性
yField 设定数据源中定义的每个圆柱体顶部高度y 坐标的数据值
xField 设定数据源中定义的每个圆柱体x坐标的位置。
minField 设定圆柱体在y坐标中的最小值