[转载]在 ASP.NET MVC 中使用 Chart 控件
- ASP.NET
- 2010-07-26
- 204热度
- 0评论
[转载]在 ASP.NET MVC 中使用 Chart 控件 - haogj - 博客园.
在 .NET 3.5 的时候,微软就提供了一个 Chart 控件,网络上有大量的关于在 VS2008 中使用这个控件的文章,在 VS2010 中,这个控件已经被集成到 ASP.NET 4.0 中,可以从工具箱中直接使用了。

这个控件在 ASP.NET 经典的页面中很容易使用,但是在 ASP.NET MVC 中使用,却会出现各种问题。
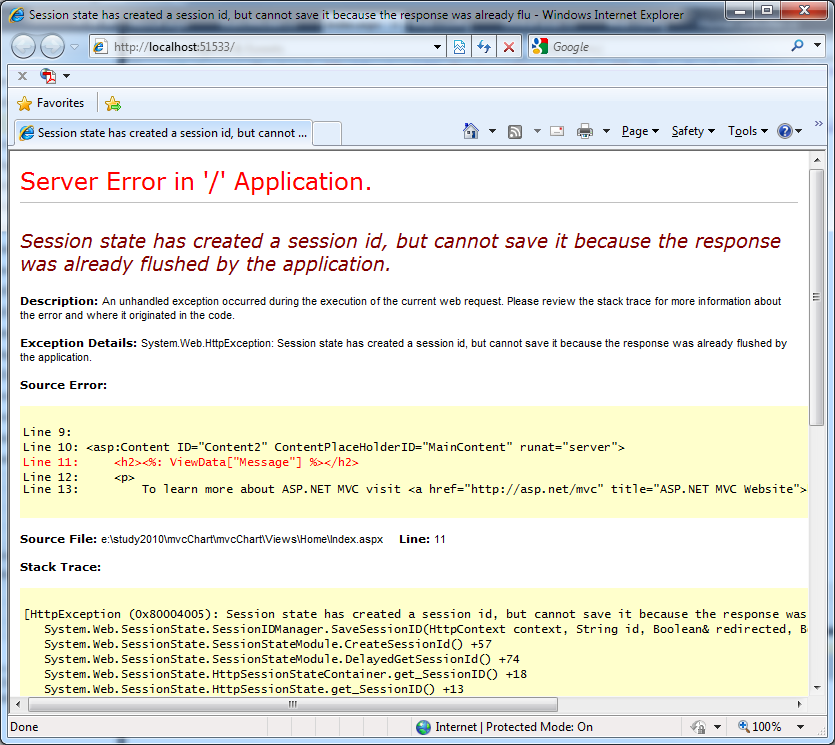
网上有的说可以这样处理,在 Global.asax 中增加一个方法。
2 {
3 string id = this.Session.SessionID;
4 }
增加之后的结果是这样。

到底应该怎样解决呢?
由于我没有看到 Chart 的源码,从错误的提示信息来说,可以看到是在 Handler 处理中出现问题。
网络上有许多关于配置的文章,例如:
ScottGu 的 Built-in Charting Controls (VS 2010 and .NET 4 Series)
Michael Ceranski 的 Building a Dashboard Using The Microsoft Chart Controls
Delian Tchoparinov 的 Handling chart generated images using Chart Http Handler
但是,很不幸,要么比较过时,大多数的配置在 VS2010 中是不需要的,要么没有解决问题。
在 ASP.NET MVC 中,处理程序的机制有了很大的变化,不再直接通过处理程序生成结果,而是经过了从处理程序到 Controler 到 Action 的多次传递。与 ASP.NET 经典模式完全不同。
Nic_Roche 在文章 Streaming Chart Images as FileResult from MVC Controllers 中提供了一个思路,在 View 中填入一个图片的引用 ,然后,通过一个 Action 返回这个图片。不过很不幸,下载之后,也没有通过。
方向没有错误,仅仅有一些小的地方需要注意。
下面,我们在 VS2010 中通过 ASP.NET MVC 实现一下。
1. 创建一个 ASP.NET MVC 项目。
2. 在 Index.aspx 这个 View 中插入一个图片的引用 ,引用的地址是一个 Action 。
3. 在项目的 Models 中增加一个 Model:StaticModel.cs,提供数据。
2 using System.Data;
3 using System.Configuration;
4 using System.Linq;
5 using System.Web;
6 using System.Web.Security;
7 using System.Web.UI;
8 using System.Web.UI.HtmlControls;
9 using System.Web.UI.WebControls;
10 using System.Web.UI.WebControls.WebParts;
11 using System.Xml.Linq;
12 using System.Collections.Generic;
13
14 namespace mvcChart.Models
15 {
16 public class StaticModel
17 {
18 public static List<int> createStaticData()
19 {
20 List<int> c_data = new List<int>();
21 c_data.Add(1);
22 c_data.Add(6);
23 c_data.Add(4);
24 c_data.Add(3);
25 return c_data;
26 }
27 }
28 }
29
4. 为 Home 的 Controler 增加一个名为 GetChart 的 Action。
注意:
1. 这个 Action 返回的类型是一个 FileResult ,也就是返回一个文件,在这个方法中,使用 FileResult 的派生类 FileStreamResult 通过流返回图片。
2. 在 33 行,将流的当前位置重新设置到起始位置,以便读取生成的图片数据。imageStream.Position = 0;
2 {
3 List<int> data = Models.StaticModel.createStaticData();
4 System.Web.UI.DataVisualization.Charting.Chart Chart2 = new System.Web.UI.DataVisualization.Charting.Chart();
5 Chart2.Width = 412;
6 Chart2.Height = 296;
7 Chart2.RenderType = System.Web.UI.DataVisualization.Charting.RenderType.ImageTag;
8 Chart2.Palette = ChartColorPalette.BrightPastel;
9 Title t = new Title("IMG source streamed from Controller", Docking.Top, new System.Drawing.Font("Trebuchet MS", 14, System.Drawing.FontStyle.Bold), System.Drawing.Color.FromArgb(26, 59, 105));
10 Chart2.Titles.Add(t);
11 Chart2.ChartAreas.Add("Series 1");
12 // create a couple of series
13 Chart2.Series.Add("Series 1");
14 Chart2.Series.Add("Series 2");
15 // add points to series 1
16 foreach (int value in data)
17 {
18 Chart2.Series["Series 1"].Points.AddY(value);
19 }
20 // add points to series 2
21 foreach (int value in data)
22 {
23 Chart2.Series["Series 2"].Points.AddY(value + 1);
24 }
25 Chart2.BorderSkin.SkinStyle = BorderSkinStyle.Emboss;
26 Chart2.BorderlineWidth = 2;
27 Chart2.BorderColor = System.Drawing.Color.Black;
28 Chart2.BorderlineDashStyle = ChartDashStyle.Solid;
29 Chart2.BorderWidth = 2;
30 Chart2.Legends.Add("Legend1");
31 MemoryStream imageStream = new MemoryStream();
32 Chart2.SaveImage(imageStream, ChartImageFormat.Png);
33 imageStream.Position = 0;
34 return new FileStreamResult(imageStream, "image/png");
35 }
最终的结果如下所示:
