[MVC]在asp.net mvc上应用新ASP.NET图表控件
- ASP.NET
- 2009-02-16
- 144热度
- 0评论
微软去年11月发布了一个很酷的新ASP.NET服务器控件,<asp:chart />,可以免费用在ASP.NET 3.5中,而且还可以用在asp.net mvc。可以看新ASP.NET图表控件<asp:chart runat="server"/>。
相关资源的下载链接:
这位台胞的两篇相当不错的文章
园子里的相关文章:
ASP.NET图表控件
我今天才知道ASP.NET图表控件发布了,附一个在线文档
在这里有一篇文章简短介绍了Combining ASP.NET MVC and ASP.NET Charting Controls.
编辑Web.Config
将控件的命名空间加到 (path: "<system.web><pages><controls>") :
<add tagPrefix="asp" namespace="System.Web.UI.DataVisualization.Charting" assembly="System.Web.DataVisualization, Version=3.5.0.0, Culture=neutral, PublicKeyToken=31bf3856ad364e35"/>
添加一个 httpHandler ("<httpHandlers>"下面) :
<add path="ChartImg.axd" verb="GET,HEAD" type="System.Web.UI.DataVisualization.Charting.ChartHttpHandler, System.Web.DataVisualization, Version=3.5.0.0, Culture=neutral, PublicKeyToken=31bf3856ad364e35" validate="false"/>
将chart 控件添加到view
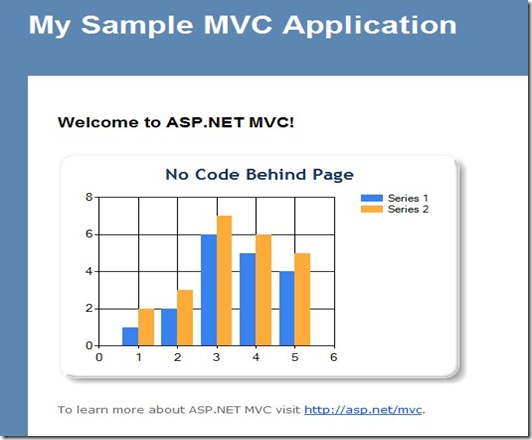
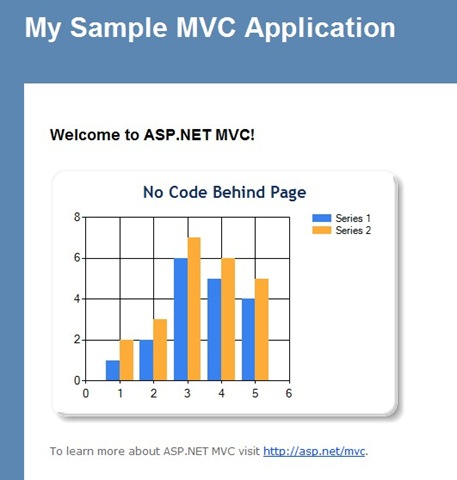
<p>
<%
System.Web.UI.DataVisualization.Charting.Chart Chart2 = new System.Web.UI.DataVisualization.Charting.Chart();
Chart2.Width = 412;
Chart2.Height = 296;
Chart2.RenderType = RenderType.ImageTag;
Chart2.Palette = ChartColorPalette.BrightPastel;
Title t = new Title("No Code Behind Page", Docking.Top, new System.Drawing.Font("Trebuchet MS", 14, System.Drawing.FontStyle.Bold), System.Drawing.Color.FromArgb(26, 59, 105));
Chart2.Titles.Add(t);
Chart2.ChartAreas.Add("Series 1");
// create a couple of series
Chart2.Series.Add("Series 1");
Chart2.Series.Add("Series 2");
// add points to series 1
foreach (int value in (List<int>)ViewData["Chart"])
{
Chart2.Series["Series 1"].Points.AddY(value);
}
// add points to series 2
foreach (int value in (List<int>)ViewData["Chart"])
{
Chart2.Series["Series 2"].Points.AddY(value + 1);
}
Chart2.BorderSkin.SkinStyle = BorderSkinStyle.Emboss;
Chart2.BorderColor = System.Drawing.Color.FromArgb(26, 59, 105);
Chart2.BorderlineDashStyle = ChartDashStyle.Solid;
Chart2.BorderWidth = 2;
Chart2.Legends.Add("Legend1");
// Render chart control
Chart2.Page = this;
HtmlTextWriter writer = new HtmlTextWriter(Page.Response.Output);
Chart2.RenderControl(writer);
%>
</p>
效果如下:
本文代码基于asp.net mvc rc版本:MVCCharting
作者: 自由、创新、研究、探索……
出处:http://shanyou.cnblogs.com/
版权:本文版权归作者和博客园共有
转载:欢迎转载,为了保存作者的创作热情,请按要求【转载】,谢谢
要求:未经作者同意,必须保留此段声明;必须在文章中给出原文连接;否则必究法律责任
个人网站: http://www.openbeta.cn
出处:http://shanyou.cnblogs.com/
版权:本文版权归作者和博客园共有
转载:欢迎转载,为了保存作者的创作热情,请按要求【转载】,谢谢
要求:未经作者同意,必须保留此段声明;必须在文章中给出原文连接;否则必究法律责任
个人网站: http://www.openbeta.cn