[SQL]优化SQL Server数据访问10个步骤四
- 开发笔记
- 2009-07-17
- 123热度
- 0评论
Introduction
Imagine you are a doctor, or a physician. What do you do when one of your patients arrive feeling out of sorts and fallen ill?
You try to understand the cause of his/her illness right? Yes. This is the most important thing to do first. Because, in order to cure your patient, you need to find out what causes your patient to fall ill. Most of the cases you study the symptoms and based upon your knowledge and experience you suggest a treatment, which works most of the cases.
But, you may not be lucky in all cases. Some patients do have complex problems with multiple types of illnesses. Studying the symptoms alone is not sufficient in these cases. You suggest diagnosing the problems and do prescribe one or more tests to be done. Pathologists then collect samples from the patient and start diagnosing for finding out the causes of the illness. Once you get the testing report, you are in a better position in understanding the problem that caused the patient’s illness and you are most likely to prescribe the correct treatment plan to cure.
Hm..sounds a familiar situation. Isn’t this the same thing we have to do while trying to debug or troubleshoot any problem in our software systems?
Yes it is. So, while we were actually trying to optimize our data access operations, it’s time for us to learn how to diagnose different performance and related problems in SQL Server database. Take a look at the following articles to learn the step by step process that we’ve already carried out so far.
Top 10 steps to optimize data access in SQL Server. Part I (Use Indexing)
Top 10 steps to optimize data access in SQL Server. Part II (Re-factor TSQLs and apply best practices)
Top 10 steps to optimize data access in SQL Server. Part III (Apply advanced indexing and denormalization)
As you might have seen already, we have gone through 7 optimization steps so far. So let us proceed to step 8 now:
Step8: Diagnose performance problem, use SQL Profiler and Performance Monitoring tool effectively.
The SQL Profiler tool is perhaps the most well-known performance troubleshooting tool in the SQL server arena. Most of the cases, when a performance problem is reported, this is the first tool that you are going to launch to investigate the problem.
As you perhaps already know, the SQL Profiler is a graphical tool for tracing and monitoring the SQL Server instance, mostly used for profiling and measuring performance of the TSQLs that are executed on the database server. You can capture about each event on the server instance and save event data to a file or table to analyze later. For example, if the production database perform slowly, you can use the SQL Profiler to see which stored procedures are taking too much time to execute.
Basic use of SQL Profiler tool
There is a 90% chance that you already know how to use it. But, I assume lots of newbie’s out there reading this article might feel good if there is a section on basic usage of SQL Profiler (If you know this tool already, just feel free to skip this section). So, here we put a brief section:
Start working with the SQL Profiler in the following way
- Launch the SQL Profiler (Tools->SQL Server Profiler in the Management Studio) and connect it to the desired SQL Server instance. Select a new trace to be created (File->New Trace) and select a trace template (A trace template is a template where some pre-selected events and columns are selected to be traced).
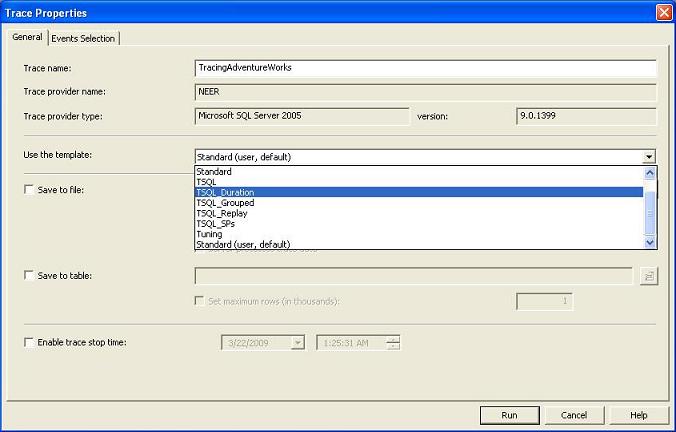
Figure: Trace template
- Optionally, select particular events (Which should be captured in the trace output) and select/deselect columns (To specify the information you want to see in the trace output).
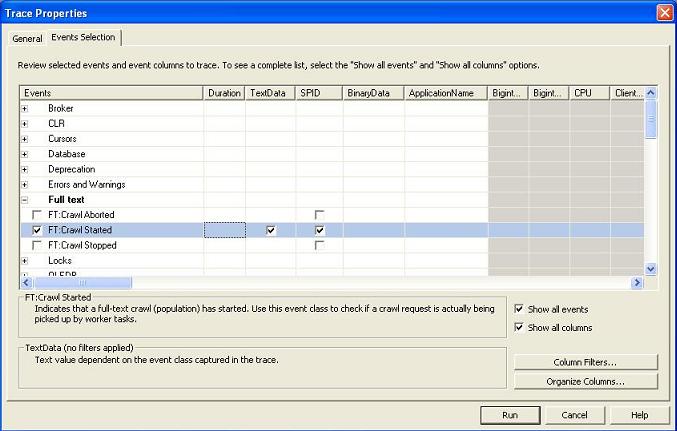
Figure : Select events to be captured for tracing
- Optionally, organize columns (Click the “Organize Columns” button) to specify the order of their appearance in the trace. Also, specify column filter values to filter the event data which you are interested in. For example, click on the “Column Filters and specify the database name value (In the “Like” text box) to trace events only for the specified database. Please note that, filtering is important because, SQL profiler would otherwise capture all unnecessary events and trace too many information that you might find difficult to deal with.
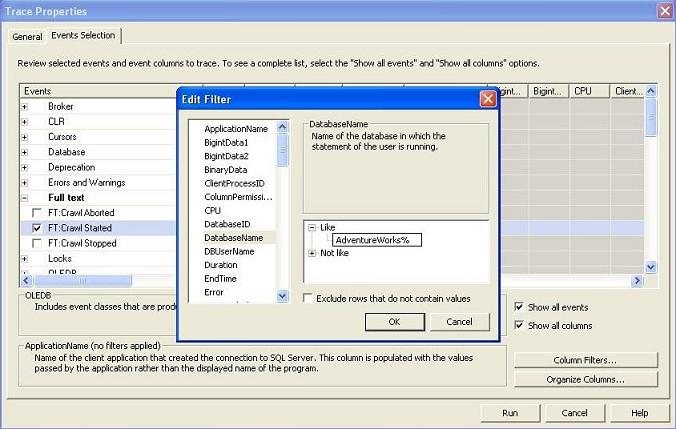
Figure : Filter column values
- Run the profiler (By clicking the green Play button) and wait for the events to be captured on the trace.
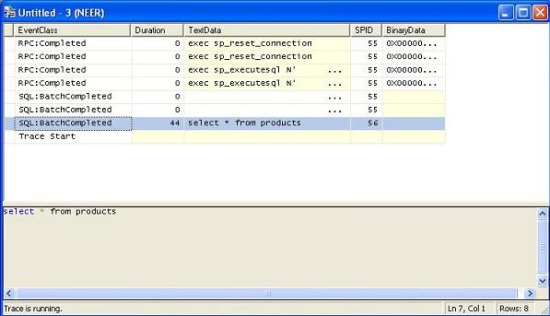
Figure : Running profiler
- When enough information is traced, stop the profiler (By pressing the red Stop icon) and save the trace either into a trace file or into an SQL Server table (You have to specify a table name and the SQL Server profiler would create the table with necessary fields and store all tracing records inside it).
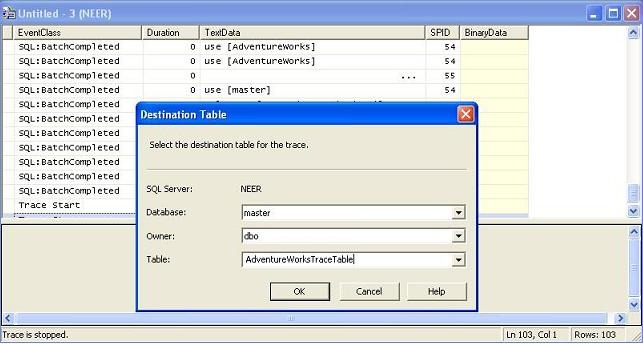
Figure : Storing profiler trace data into table
- If the trace is saved on a table, issue a query to retrieve the expensive TSQL’s using a query like the following :
Select TextData,Duration,…, FROM Table_Name ORDER BY
Duration DESC
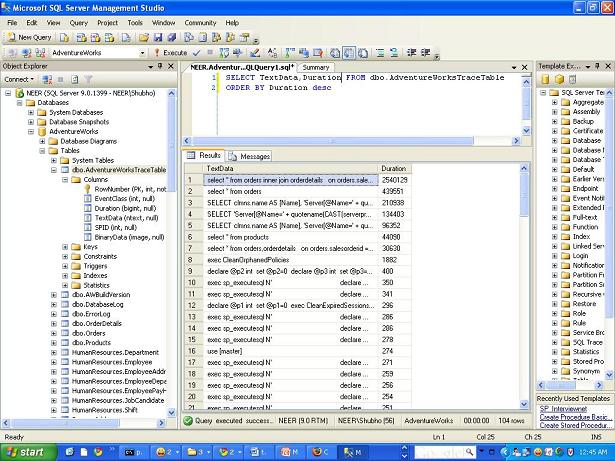
Figure : Querying for most expensive TSQL/Stored procedure
Voila! You just identified the most expensive TSQLs in your application in a quick time.
Effective use of SQL Profiler to troubleshot performance related problems
Most of the cases, the SQL profiler tool is used to trace the most expensive TSQLs/Stored Procedures in the target database to find the culprit one that is responsible for performance problem (Described above). But, the tool is not limited to provide only TSQL duration information. You can use many powerful features of this tool to diagnose and troubleshoot different kinds of problems that could occur due to many possible reasons.
When you are running the SQL Profiler, there are two possibilities. Either you have a reported performance related issue that you need to diagnose, or, you need to diagnose any possible performance issue in advance so that you can make sure you system would perform blazing fast in the production after deployment.
Following are some tips that you can follow while using the SQL Profiler tool:
-
Use existing templates, but, create your own template when in need.
Most of the times the existing templates will serve your purpose. But still, there could be situations when you will need a customized template for diagnosing a specific kind of problem in the database server (Say, Deadlock occurring in the production server). In this situation, you can create a customized template using FileàTemplatesàNew Template and specifying the Template name and events and columns. Also, you can select an existing template and modify it according to your need.

Figure : Creating a new template
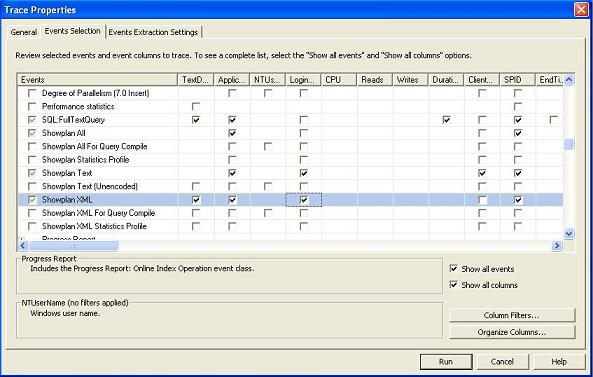
Figure : Specifying events and columns for the new template
-
Capture TableScan or DeadLock events
Did you know that you can listen to these two interesting events using the SQL profiler?
Imagine a situation where you have done all possible indexing in your test database, and after testing, you have implemented the indexes in the production server. Now suppose, for some unknown reasons, you are not getting the desired performance in the production database. You suspect that, some undesired table scanning is taking place while executing one of the queries. You need to detect the table scan and get rid of it, but, how could you investigate this?
Another situation. Suppose, you have a deployed system where error mails are being configured to be sent to a pre-configured email address (So that, the development team can be notified instantly and with enough information to diagnose the problem). All on a sudden, you start getting error mails stating that deadlocks are occurring in the database (With exception message from database containing database level error codes). You need to investigate and find the situation and corresponding set of TSQLs that are responsible for creating the deadlock in the production database. How would you carry this out?
SQL profiler gives you possible ways to investigate it. You can edit the templates so that, the profiler listens for any Table scan or deadlock event that might take place in the database. To do this, check the Deadlock Graph, Deadlock and DeadLock chain events in the DeadLock section while creating/editing the tracing template. Then, start the profiler and run your application. Sooner or later when any table scan or deadlock occurs in the database, the corresponding events would be captured in the profiler trace and you would be able to find out the corresponding TSQLs that are responsible for the above described situation. Isn’t that nice?
Note: You might also require the SQL Server log file to write deadlock events so that you can get important context information from the log when the deadlock took place. This is important because, sometimes you need to combine the SQL Server deadlock trace information with that of the SQL Server log file to detect the involved database objects and TSQLs that are causing deadlocks.

Figure : Detecting Table scan
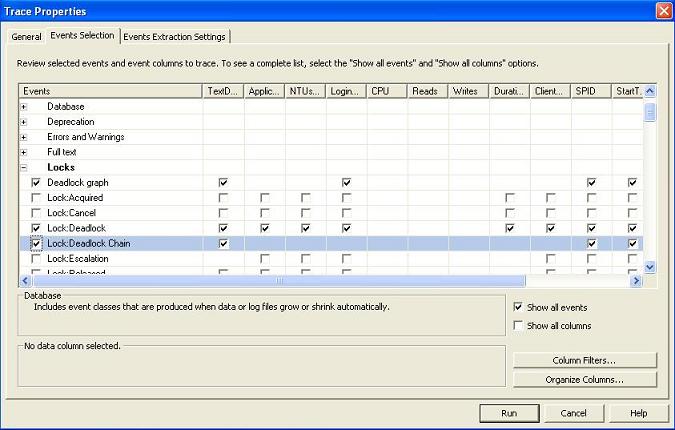
Figure : Detecting Deadlocks
-
Create Replay trace
As you already know, in order to troubleshoot any performance problem in the production database server, you need to try to simulate the same environment (Set of queries, number of connections in a given time period that are executed in the production database) in your Test database server first so that, the performance problem can be re-generated (Without re-generating the problem, you can’t fix it, right?). How can you do this?
The SQL Profiler tool lets you do this by using a Replay trace. You can use a TSQL_Replay Trace template to capture events in the production server and save that trace in a .trace file. Then, you can replay the trace on test server to re-generate and diagnose problems.
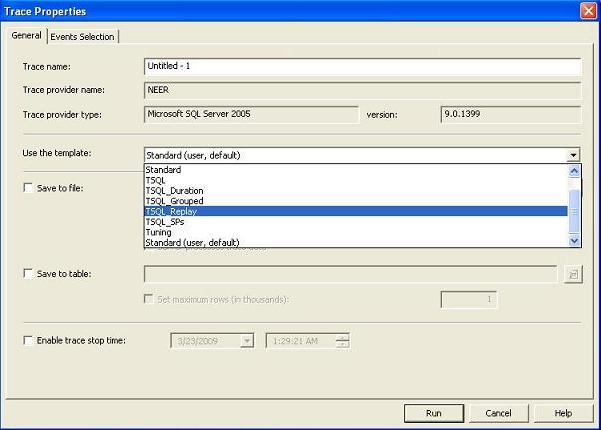
Figure : Creaging Replay trace
To learn more about TSQL Replay trace, see http://msdn.microsoft.com/en-us/library/ms189604.aspx
-
Create Tuning trace
The Database tuning advisor is a great tool that can give you good tuning suggestions to enhance your database performance. But, to get a good and realistic suggestion from the tuning advisor, you need to provide the tool with “appropriate load” that is similar to the production environment. That is, you need to execute the same the set of TSQL’s and open the same number of concurrent connections in the test server and then run the tuning advisor there. The SQL Profiler lets you capture the appropriate set of events and columns (for creating load in the tuning advisor tool) by the Tuning template. Run the profiler using the Tuning template, capture the traces and save it. Then, use the tuning trace file for creating load in the test server by using the Tuning advisor tool.
You would like to learn and use the Database tuning advisor to get tuning suggestions while you try to troubleshoot performance issues in SQL Server. Take a look at this article to learn this interesting tool : http://msdn.microsoft.com/en-us/library/ms166575.aspx
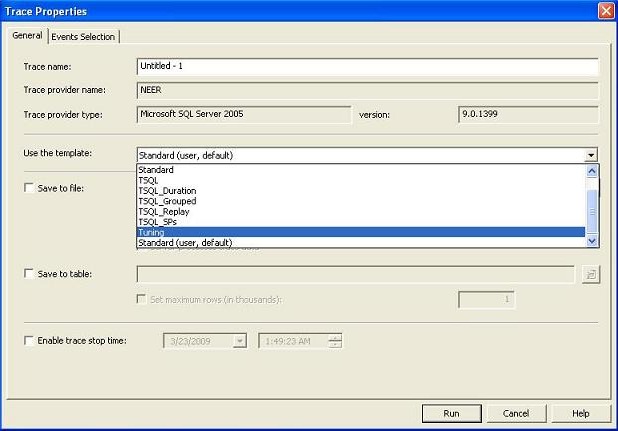
Figure : Create Tuning profiler trace
-
Capture ShowPlan to include SQL execution plans in the profiler.
There will be times when the same query will give you different performance in the Production and Test server. Suppose, you have been reported with this kind of a problem and to investigate the performance problem, you need to take a look at the TSQL execution plan that is being used in the Production server for executing the actual Query.
Now, it is obvious that, you just cannot run that TSQL (That is causing performance problem) in the production server to view the actual execution plan for lots of reasons. You can of course take a look at the estimated execution plan for a similar query, but, this execution plan might not reflect you the true execution plan that is used in reality in a fully loaded production database.The SQL Profiler can help you in this regard. You can include ShowPlan, or, ShowPlan XML in your trace while profiling in the Production server. Doing this would capture SQL plans along with the TSQL text while tracing. Do this in the test server too and analyze and compare both execution plans to find out the difference in them very easily.
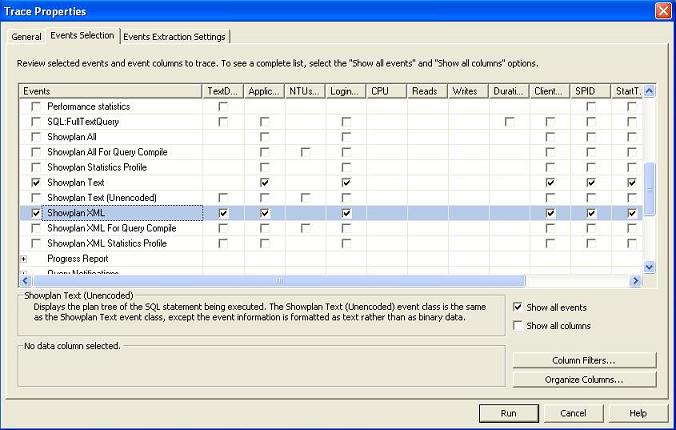
Figure : Specifying Execution plans to be included in the trace

Figure : Execution plan in the profiler trace
Use Performance monitoring tool (Perfmon) to diagnose performance problems
When you encounter performance related problems in your database, the SQL Profiler would enable you to diagnose and find out the reasons behind the performance issues most of the cases. But, sometimes the Profiler alone cannot help you identifying the exact cause of the problems.
For example, analyzing the query execution time using the Profiler in the production server you’ve seen that, the corresponding TSQL is executing slowly (Say, 10 seconds), though, the same query takes a much lower time in the Test server (Say, 200 ms). You analyzed the query execution plans and data volume and found those to be roughly the same. So there must have been some other issues that are creating a bottleneck situation in the production server. How would you diagnose this problem then?
The Performance Monitoring Tool (Known as Perfmon) comes to your aid in these kinds of situations. Performance Monitor is a tool (That is built in within the Windows OS) gathers statistical data related to hardware and software metrics from time to time.
When you issue a TSQL to execute in the database server, there are many stakeholders participating in the actions to execute the query and return result. These include the TSQL Execution engine, Server buffer cache, SQL Optimizer, Output queue, CPU, Disk I/O and lots of other things. So, if one of these does not perform its corresponding task well and fast, the ultimate query execution time taken by the database server would be high. Using the Performance Monitoring tool you can take a microscopic look at the performance of these individual components and identify the root cause of the performance problem.
With the Performance Monitoring tool (System monitor) you can create a counter log including different built in counters (That measures performance of each individual components while executing the queries) and analyze the counter log with a graphical view to understand what’s going on in detail. Moreover, you can combine the Performance counter log with the SQL Profiler trace for a certain period of time to better understand the complete situation while executing a query.
Basic use of Performance Monitor
Windows has lots of built in objects with their corresponding performance counters. These are installed when you install the Windows. While the SQL Server gets installed, Performance counters for SQL server also get installed. Hence, these counters are available when you define a performance counter log.
Follow these steps to create a performance counter log:
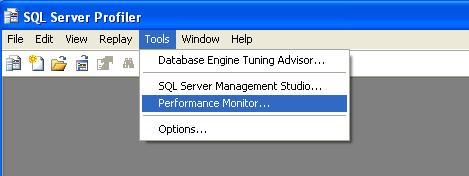
- Launch the Performance Monitor tool from Tools->Performance Monitor in the SQL profiler tool
Figure : Launch Performance Monitor tool
- Create a new Performance Counter log by clicking on the Counter Logs->New Log Settings
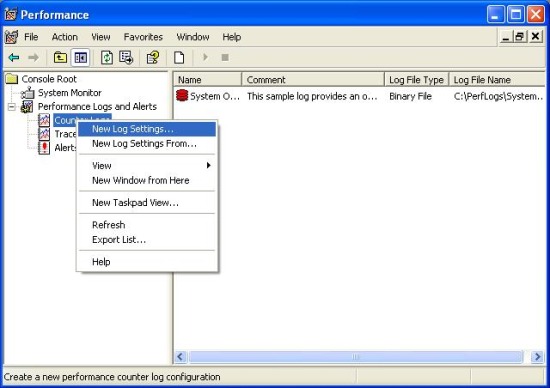
Figure : Create a Performance counter log
Specify log file name and press OK.
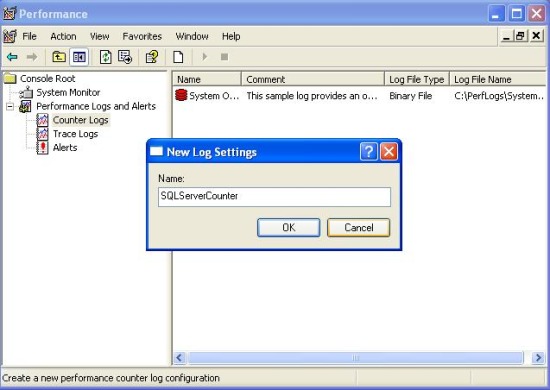
Figure : Specify name for the Performance coutner log
- Click on the “Add Counters” button to select the preferred counters in the newly created counter log.
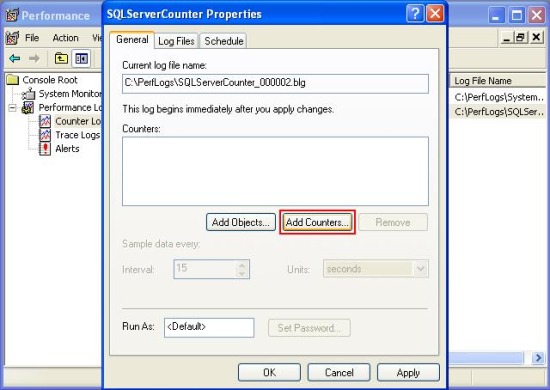
Figure : Add counters for the Performane counter log
- Add the preferred counters by selecting desired objects and their corresponding counters from the list. Click on “Close” when done.
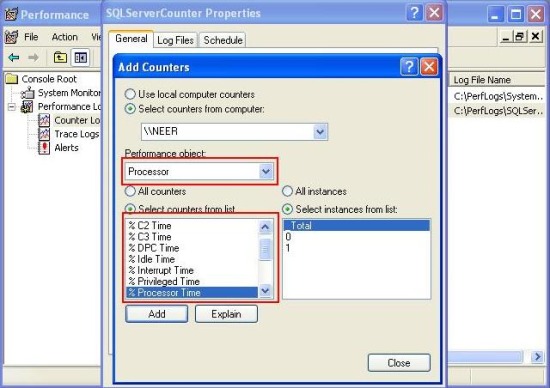
Figure : Specify objects and corresponding counters
- The selected counters will be displayed in the form
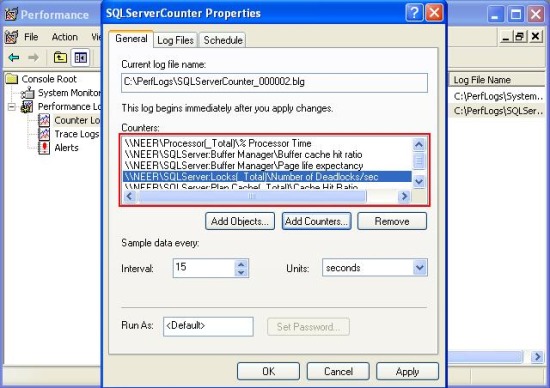
Figure : Specify counters
- Click on the Log Files tab and click on the “Configure” tab to specify the log file location and modify log file name if required. Click “OK” when done.
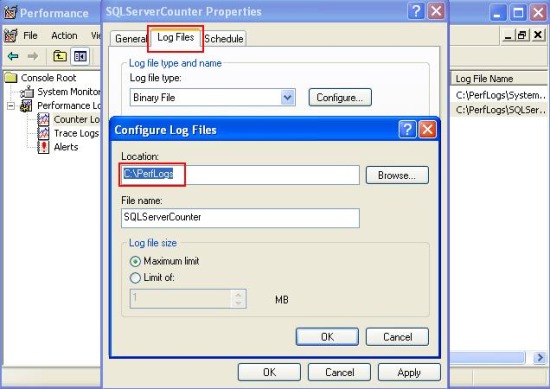
Figure : Specify Performance counter log location
- Click on the “Schedule” tab to specify a schedule for reading the counter information and write in the log file. Optionally, you can also select “Manually” for “Start log” and “Stop log” options in which case, the counter data will be logged after you start the performance counter log
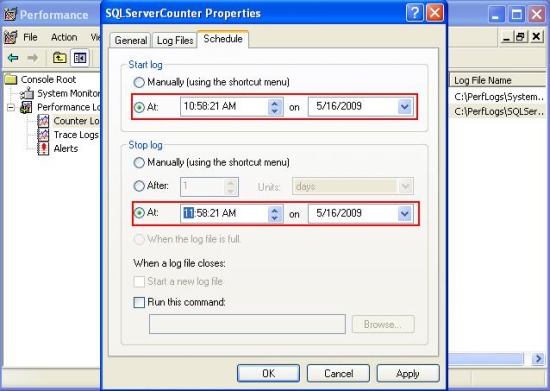
Figure : Scheduling the Performance coutner log operation
- Click on the “General” tab and specify the interval for gathering counter data
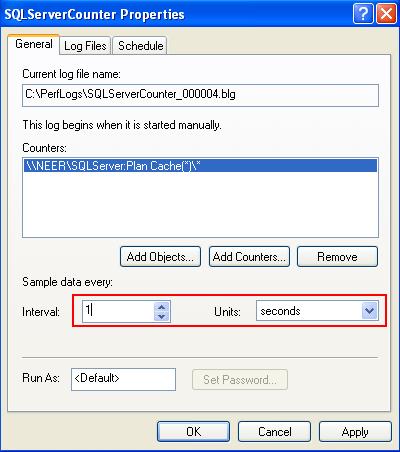
Figure : Setting counter sample interval
- Press “OK” and start performance counter log by selecting the counter log and clicking start. When done, stop the counter log.
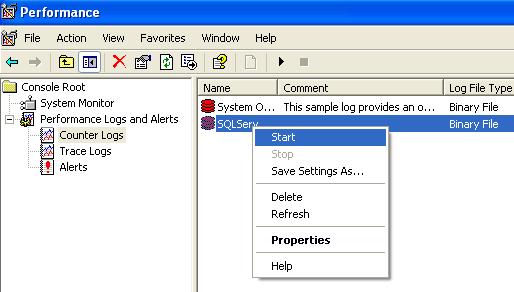
Figure : Starting the Performance counter logging
- For viewing log data close and open the Performance monitor tool again. Click on the view log icon (The icon in the red box) to view counter log. Click on the “Source” tab and select “Log files” radio button and add the log file to view by clicking on the “Add button”.
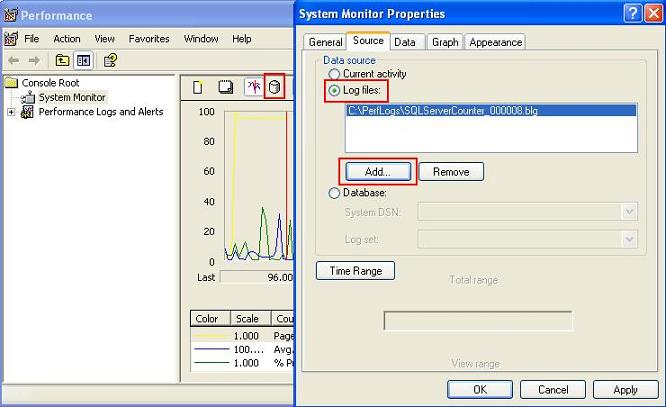
Figure : Viewing Performance coutner log
- By default, only three default counters are selected to be shown in the counter log output. Specify other counters (That were included while creating the Coutner log) by clicking on the “Data” tab and selecting the desired counters by clicking on the “Add” button.
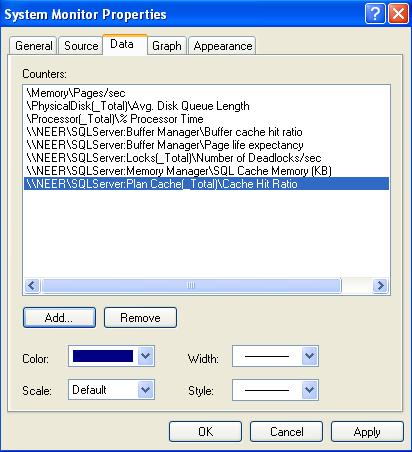
Figure : Specifying coutners to view data in log
- Click “OK” button to view the performance counter log output in a graphical view
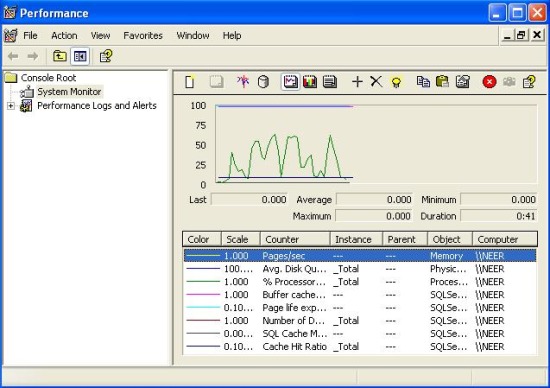
Figure : Viewing the Performance coutner log
Correlate Performance counter log and SQL Profiler trace for better investigation
The SQL Profiler can give you information about the long running queries, but, it cannot provide you with the context information to explain the reason for long query execution time.
On the other hand, the Performance monitor tool gives you statistics regarding the individual component’s performance (Context information) but, it does not give you information regarding the query execution time.
So, by combining the performance counter log with the SQL Profiler trace you can get the complete picture while diagnosing performance problems in SQL Server.
Correlating these two things serve another important purpose also. If the same query takes longer time in production server to execute, but, takes shorter time in test server, that indicates the test server may not have the same amount of load, environment and query execution context as the production server has. So, to diagnose the performance problem, you need a way to simulate the Production server’s query execution context in the Test server somehow. You can do this by correlating the SQL Profiler trace at the Test server with the Performance counter log that is taken at the Production server (Obviously, the SQL Profiler trace and Performance counter log that are taken within a same time period can only be correlated).
Correlating these two tool’s output can help you identifying the exact root cause of the performance problem. For example, you might find that each time the query takes 10 seconds to execute in the Production server, the CPU utilization reaches up to 100%. So, instead of trying to tune the SQL, you should investigate the reason why the CPU utilization rises up to 100% to optimize the query performance.
Follow these steps to correlate the SQL Profiler trace with the Performance counter log
- Create a Performance Counter log by incorporating the following common performance counters. Specify “Manual” option for starting and stopping the counter log.
--Network Interface\Output Queue length
--Processor\%Processor Time
--SQL Server:Buffer Manager\Buffer Cache Hit Ratio
--SQL Server:Buffer Manager\Page Life Expectancy
--SQL Server:SQL Statistics\Batch Requests/Sec
--SQL Server:SQL Statistics\SQL Compilations
--SQL Server:SQL Statistics\SQL Re-compilations/Sec
Create the performance counter log, but, don’t start it.
- Using the SQL Profiler, create a trace using the TSQL Duration template (For simplicity). Add “Start Time” and “End Time” column to the trace and Start the Profiler trace and the Performance counter log created in the previous step at the same time.
- When enough tracing has been done, stop both SQL Profiler trace and the Performance counter log at the same time. Save the SQL Profiler trace as a .trc file in the file system.
- Close the SQL Profiler trace window and open the trace file again with the Profiler s(.trc file) that was saved in the previous step (Yes, you have to close the Profiler trace and open the trace file again, otherwise, you won’t get the “Import Performance Data” option enabled. This looks like a bug in the Management Studio). Click on the “File->Import Performance Data” to correlate the Performance Counter log with the SQL Profiler trace. (If the Import Performance Data option is disabled, something is wrong and review your steps from the beginning). A file browser window will appear and select the Performance counter log file in the file system that is to be correlated.
- A window will appear to select the counters to correlate. Select all counters and press “OK”. You will be presented with a screen like the below that is the correlated output of SQL Profiler trace and Performance Counter log.
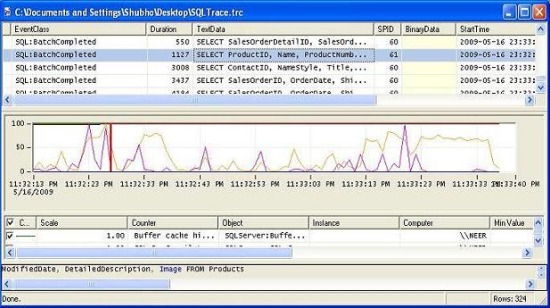
Figure : Correlated output of SQL Profiler and Performance Monitor tool
- Click on a particular TSQL in the Profiler trace output (In the upper part of the window). You’ll see that, a Red vertical bar will be set in the Performance counter log output to indicate the particular counter statistics when that particular query was being executed. Similarly, click on the Performance counter log output any where you see a certain performance counter’s value is high (Or, above the normal value). You’ll see that, the corresponding TSQL that was being executed on the database server will be highlighted in the SQL Profiler trace output.
I bet, you’ll surely find correlating these two tools output extremely interesting and handy.
Last words
There are a bunch of tools and techniques available for diagnosing performance problems in SQL Server. For example, you may like to review the SQL Server log file when any such problems are reported. Also, you may like to use the Database Tuning Advisor (DTA) for getting tuning suggestions for optimizing the database. Whatever the tool you use, you need to be able to take a deep look into the internal details to understand what’s going on behind the seen. Once you identify the actual cause of the performance problem, solution is the easiest part most of the cases.
I assume we have sufficient knowledge on diagnosing performance problems in SQL Server so far, along with the optimization steps that we’ve gone through. We are now heading towards the last part of this series of articles. Our optimization mission is going to be ended in the following next article:
"Top 10 steps to optimize data access in SQL Server. Part V (Optimize database files and apply partitioning)"
All's well that ends well. Hope to see you there!
License
This article, along with any associated source code and files, is licensed under The Code Project Open License (CPOL)
About the Author
M.M.Al-Farooque Shubho Member |
A passionate software developer who loves to think, learn and observe the world around. Working in the .NET based software application development for quite a few years. My LinkedIn profile will tell you more about me. Have a look at My other CodeProject articles. Learn about my visions, thoughts and findings at My Blog. Awards: Prize winner in Competition "Best Asp.net article of May 2009" Prize winner in Competition "Best overall article of May 2009" Prize winner in Competition "Best overall article of April 2009"
|