Expires and Cache-Control: max-age. 即内容在缓存中的生命有效期。第一次请求后,在生命有效期之内的后期请求直接从本地缓存中取,不过问服务器;
Last-Modified and ETag. 其中Last-Modified标记文件最后一次修改的时间,浏览器第二次请求是在头部加入上次请求缓存下来的Last-Modified时间,如何两次 请求期间服务器的内容没有进行修改,服务器直接返回304 Not Modified,浏览器接到以后直接使用本地缓存。否则,服务器会返回200以及更新后的版本。ETag是服务器对于文件生成的Hash散列,其生成算 法与最后一次修改的时间相关。浏览器第二次请求发送上次的ETag信息,服务器通过简单的比对就知道是否应该返回304还是200。
Imagine you are a doctor, or a physician. What do you do when one of your patients arrive feeling out of sorts and fallen ill?
You try to understand the cause of his/her illness right? Yes. This is the most important thing to do first. Because, in order to cure your patient, you need to find out what causes your patient to fall ill. Most of the cases you study the symptoms and based upon your knowledge and experience you suggest a treatment, which works most of the cases.
But, you may not be lucky in all cases. Some patients do have complex problems with multiple types of illnesses. Studying the symptoms alone is not sufficient in these cases. You suggest diagnosing the problems and do prescribe one or more tests to be done. Pathologists then collect samples from the patient and start diagnosing for finding out the causes of the illness. Once you get the testing report, you are in a better position in understanding the problem that caused the patient’s illness and you are most likely to prescribe the correct treatment plan to cure.
Hm..sounds a familiar situation. Isn’t this the same thing we have to do while trying to Debug or troubleshoot any problem in our software systems?
Yes it is. So, while we were actually trying to optimize our data access operations, it’s time for us to learn how to diagnose different performance and related problems in SQL Server database. Take a look at the following articles to learn the step by step process that we’ve already carried out so far.
As you might have seen already, we have gone through 7 optimization steps so far. So let us proceed to step 8 now:
Step8: Diagnose performance problem, use SQL Profiler and Performance Monitoring tool effectively.
The SQL Profiler tool is perhaps the most well-known performance troubleshooting tool in the SQL server arena. Most of the cases, when a performance problem is reported, this is the first tool that you are going to launch to investigate the problem.
As you perhaps already know, the SQL Profiler is a graphical tool for tracing and monitoring the SQL Server instance, mostly used for profiling and measuring performance of the TSQLs that are executed on the database server. You can capture about each event on the server instance and save event data to a file or table to analyze later. For example, if the production database perform slowly, you can use the SQL Profiler to see which stored procedures are taking too much time to execute.
Basic use of SQL Profiler tool
There is a 90% chance that you already know how to use it. But, I assume lots of newbie’s out there reading this article might feel good if there is a section on basic usage of SQL Profiler (If you know this tool already, just feel free to skip this section). So, here we put a brief section:
Start working with the SQL Profiler in the following way
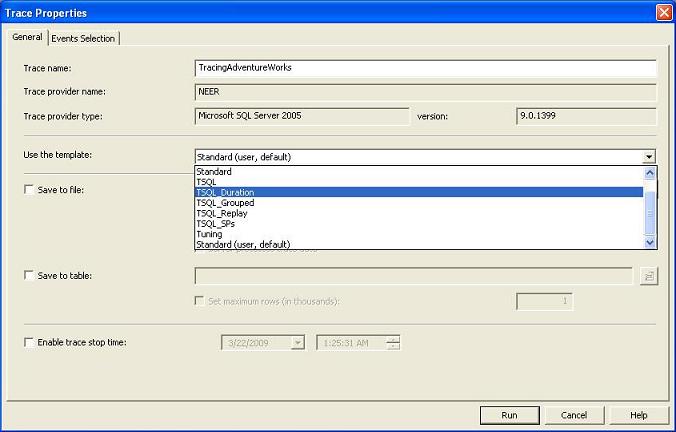
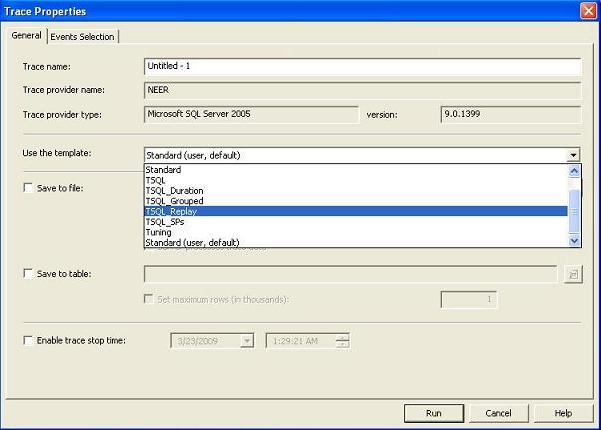
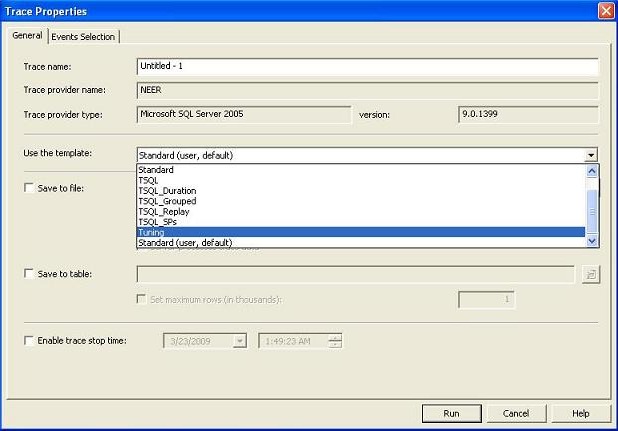
Launch the SQL Profiler (Tools->SQL Server Profiler in the Management Studio) and connect it to the desired SQL Server instance. Select a new trace to be created (File->New Trace) and select a trace template (A trace template is a template where some pre-selected events and columns are selected to be traced).
Figure: Trace template
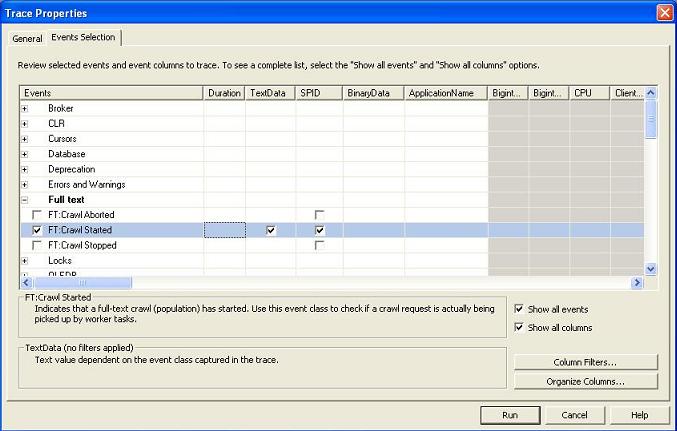
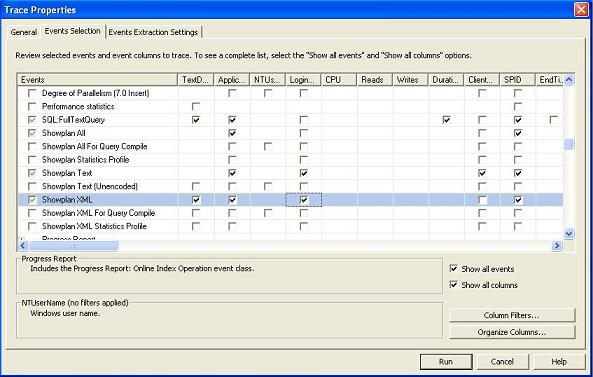
Optionally, select particular events (Which should be captured in the trace output) and select/deselect columns (To specify the information you want to see in the trace output).
Figure : Select events to be captured for tracing
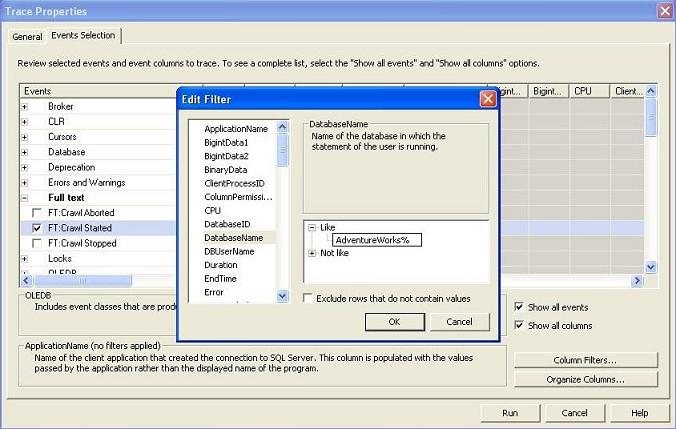
Optionally, organize columns (Click the “Organize Columns” button) to specify the order of their appearance in the trace. Also, specify column filter values to filter the event data which you are interested in. For example, click on the “Column Filters and specify the database name value (In the “Like” text box) to trace events only for the specified database. Please note that, filtering is important because, SQL profiler would otherwise capture all unnecessary events and trace too many information that you might find difficult to deal with.
Figure : Filter column values
Run the profiler (By clicking the green Play button) and wait for the events to be captured on the trace.
Figure : Running profiler
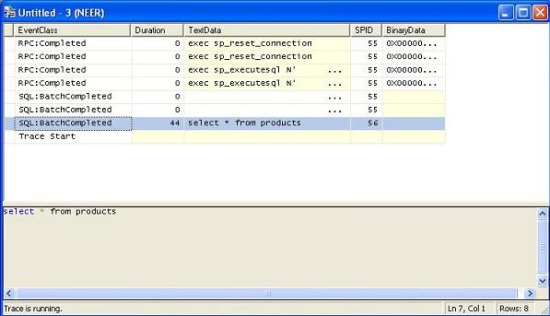
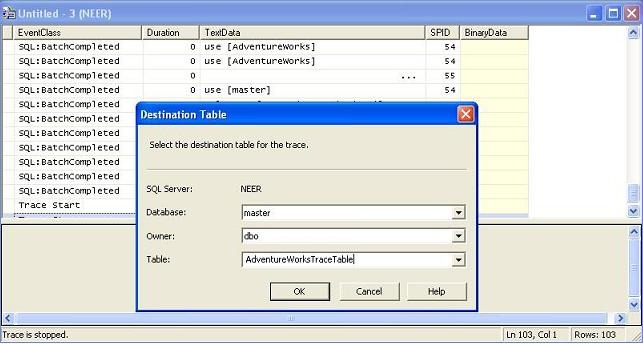
When enough information is traced, stop the profiler (By pressing the red Stop icon) and save the trace either into a trace file or into an SQL Server table (You have to specify a table name and the SQL Server profiler would create the table with necessary fields and store all tracing records inside it).
Figure : Storing profiler trace data into table
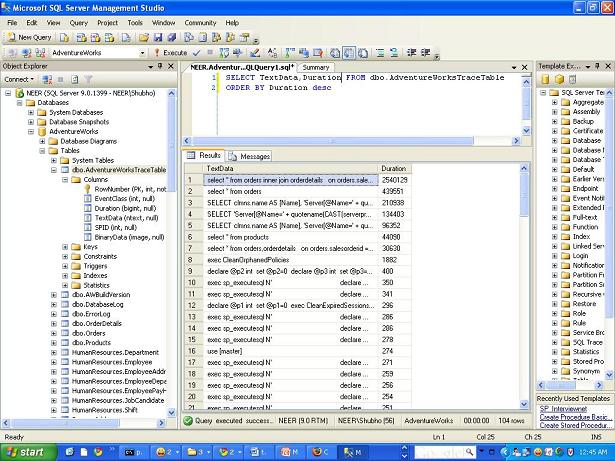
If the trace is saved on a table, issue a query to retrieve the expensive TSQL’s using a query like the following :
Collapse
Select TextData,Duration,…, FROM Table_Name ORDERBY
Duration DESC
Figure : Querying for most expensive TSQL/Stored procedure
Voila! You just identified the most expensive TSQLs in your application in a quick time.
Effective use of SQL Profiler to troubleshot performance related problems
Most of the cases, the SQL profiler tool is used to trace the most expensive TSQLs/Stored Procedures in the target database to find the culprit one that is responsible for performance problem (Described above). But, the tool is not limited to provide only TSQL duration information. You can use many powerful features of this tool to diagnose and troubleshoot different kinds of problems that could occur due to many possible reasons.
When you are running the SQL Profiler, there are two possibilities. Either you have a reported performance related issue that you need to diagnose, or, you need to diagnose any possible performance issue in advance so that you can make sure you system would perform blazing fast in the production after deployment.
Following are some tips that you can follow while using the SQL Profiler tool:
Use existing templates, but, create your own template when in need.
Most of the times the existing templates will serve your purpose. But still, there could be situations when you will need a customized template for diagnosing a specific kind of problem in the database server (Say, Deadlock occurring in the production server). In this situation, you can create a customized template using FileàTemplatesàNew Template and specifying the Template name and events and columns. Also, you can select an existing template and modify it according to your need.
Figure : Creating a new template
Figure : Specifying events and columns for the new template
Capture TableScan or DeadLock events
Did you know that you can listen to these two interesting events using the SQL profiler?
Imagine a situation where you have done all possible indexing in your test database, and after testing, you have implemented the indexes in the production server. Now suppose, for some unknown reasons, you are not getting the desired performance in the production database. You suspect that, some undesired table scanning is taking place while executing one of the queries. You need to detect the table scan and get rid of it, but, how could you investigate this?
Another situation. Suppose, you have a deployed system where error mails are being configured to be sent to a pre-configured email address (So that, the development team can be notified instantly and with enough information to diagnose the problem). All on a sudden, you start getting error mails stating that deadlocks are occurring in the database (With exception message from database containing database level error codes). You need to investigate and find the situation and corresponding set of TSQLs that are responsible for creating the deadlock in the production database. How would you carry this out?
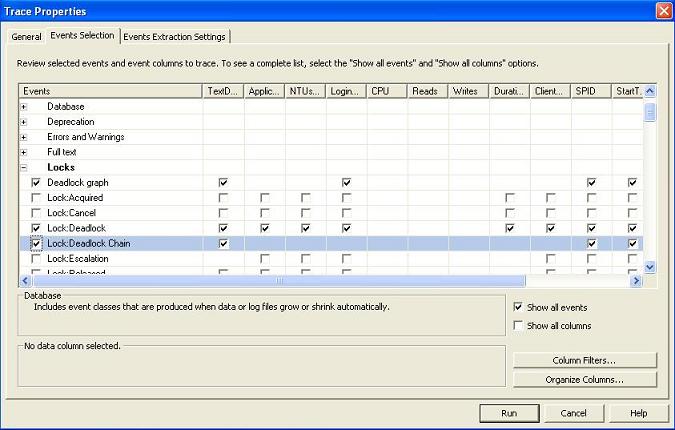
SQL profiler gives you possible ways to investigate it. You can edit the templates so that, the profiler listens for any Table scan or deadlock event that might take place in the database. To do this, check the Deadlock Graph, Deadlock and DeadLock chain events in the DeadLock section while creating/editing the tracing template. Then, start the profiler and run your application. Sooner or later when any table scan or deadlock occurs in the database, the corresponding events would be captured in the profiler trace and you would be able to find out the corresponding TSQLs that are responsible for the above described situation. Isn’t that nice?
Note: You might also require the SQL Server log file to write deadlock events so that you can get important context information from the log when the deadlock took place. This is important because, sometimes you need to combine the SQL Server deadlock trace information with that of the SQL Server log file to detect the involved database objects and TSQLs that are causing deadlocks.
Figure : Detecting Table scan
Figure : Detecting Deadlocks
Create Replay trace
As you already know, in order to troubleshoot any performance problem in the production database server, you need to try to simulate the same environment (Set of queries, number of connections in a given time period that are executed in the production database) in your Test database server first so that, the performance problem can be re-generated (Without re-generating the problem, you can’t fix it, right?). How can you do this?
The SQL Profiler tool lets you do this by using a Replay trace. You can use a TSQL_Replay Trace template to capture events in the production server and save that trace in a .trace file. Then, you can replay the trace on test server to re-generate and diagnose problems.
The Database tuning advisor is a great tool that can give you good tuning suggestions to enhance your database performance. But, to get a good and realistic suggestion from the tuning advisor, you need to provide the tool with “appropriate load” that is similar to the production environment. That is, you need to execute the same the set of TSQL’s and open the same number of concurrent connections in the test server and then run the tuning advisor there. The SQL Profiler lets you capture the appropriate set of events and columns (for creating load in the tuning advisor tool) by the Tuning template. Run the profiler using the Tuning template, capture the traces and save it. Then, use the tuning trace file for creating load in the test server by using the Tuning advisor tool.
You would like to learn and use the Database tuning advisor to get tuning suggestions while you try to troubleshoot performance issues in SQL Server. Take a look at this article to learn this interesting tool : http://msdn.microsoft.com/en-us/library/ms166575.aspx
Figure : Create Tuning profiler trace
Capture ShowPlan to include SQL execution plans in the profiler.
There will be times when the same query will give you different performance in the Production and Test server. Suppose, you have been reported with this kind of a problem and to investigate the performance problem, you need to take a look at the TSQL execution plan that is being used in the Production server for executing the actual Query.
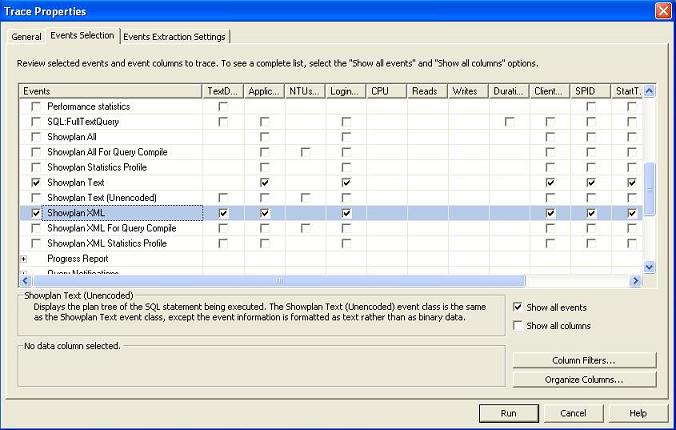
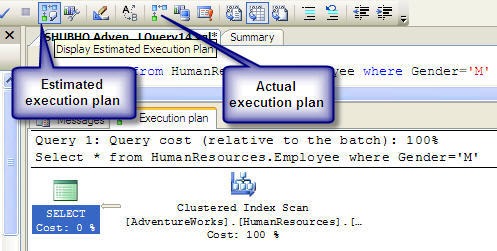
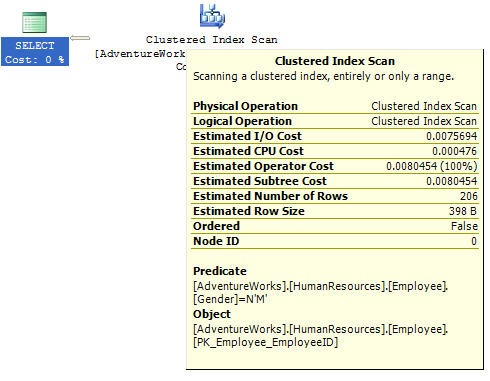
Now, it is obvious that, you just cannot run that TSQL (That is causing performance problem) in the production server to view the actual execution plan for lots of reasons. You can of course take a look at the estimated execution plan for a similar query, but, this execution plan might not reflect you the true execution plan that is used in reality in a fully loaded production database.The SQL Profiler can help you in this regard. You can include ShowPlan, or, ShowPlan XML in your trace while profiling in the Production server. Doing this would capture SQL plans along with the TSQL text while tracing. Do this in the test server too and analyze and compare both execution plans to find out the difference in them very easily.
Figure : Specifying Execution plans to be included in the trace
Figure : Execution plan in the profiler trace
Use Performance monitoring tool (Perfmon) to diagnose performance problems
When you encounter performance related problems in your database, the SQL Profiler would enable you to diagnose and find out the reasons behind the performance issues most of the cases. But, sometimes the Profiler alone cannot help you identifying the exact cause of the problems.
For example, analyzing the query execution time using the Profiler in the production server you’ve seen that, the corresponding TSQL is executing slowly (Say, 10 seconds), though, the same query takes a much lower time in the Test server (Say, 200 ms). You analyzed the query execution plans and data volume and found those to be roughly the same. So there must have been some other issues that are creating a bottleneck situation in the production server. How would you diagnose this problem then?
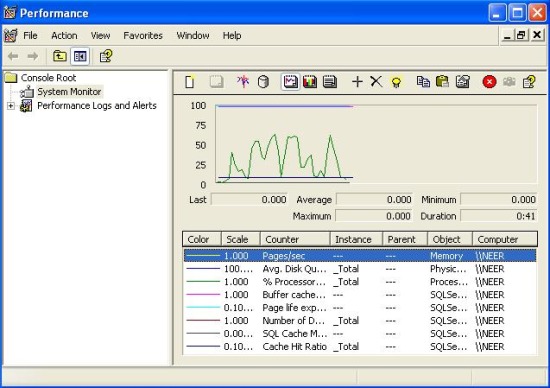
The Performance Monitoring Tool (Known as Perfmon) comes to your aid in these kinds of situations. Performance Monitor is a tool (That is built in within the Windows OS) gathers statistical data related to hardware and software metrics from time to time.
When you issue a TSQL to execute in the database server, there are many stakeholders participating in the actions to execute the query and return result. These include the TSQL Execution engine, Server buffer cache, SQL Optimizer, Output queue, CPU, Disk I/O and lots of other things. So, if one of these does not perform its corresponding task well and fast, the ultimate query execution time taken by the database server would be high. Using the Performance Monitoring tool you can take a microscopic look at the performance of these individual components and identify the root cause of the performance problem.
With the Performance Monitoring tool (System monitor) you can create a counter log including different built in counters (That measures performance of each individual components while executing the queries) and analyze the counter log with a graphical view to understand what’s going on in detail. Moreover, you can combine the Performance counter log with the SQL Profiler trace for a certain period of time to better understand the complete situation while executing a query.
Basic use of Performance Monitor
Windows has lots of built in objects with their corresponding performance counters. These are installed when you install the Windows. While the SQL Server gets installed, Performance counters for SQL server also get installed. Hence, these counters are available when you define a performance counter log.
Follow these steps to create a performance counter log:
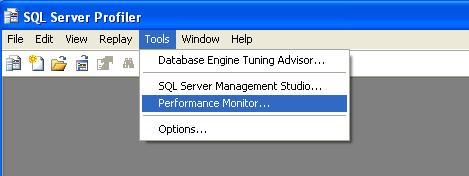
Launch the Performance Monitor tool from Tools->Performance Monitor in the SQL profiler tool
Figure : Launch Performance Monitor tool
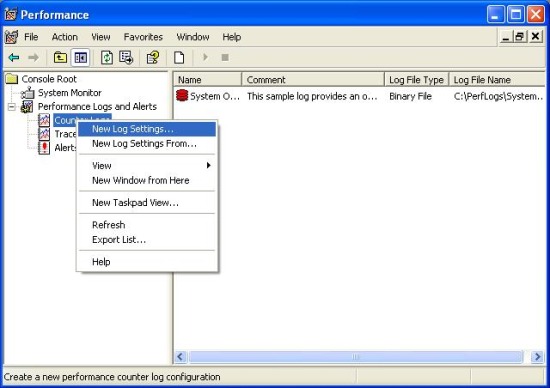
Create a new Performance Counter log by clicking on the Counter Logs->New Log Settings
Figure : Create a Performance counter log
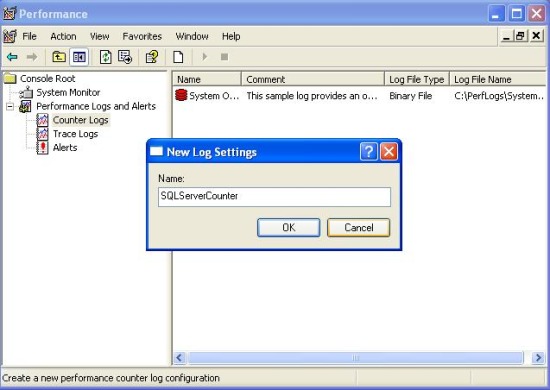
Specify log file name and press OK.
Figure : Specify name for the Performance coutner log
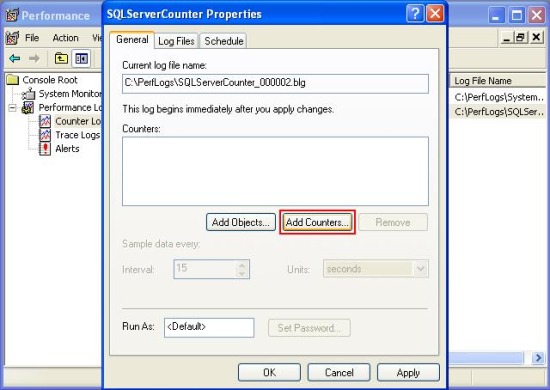
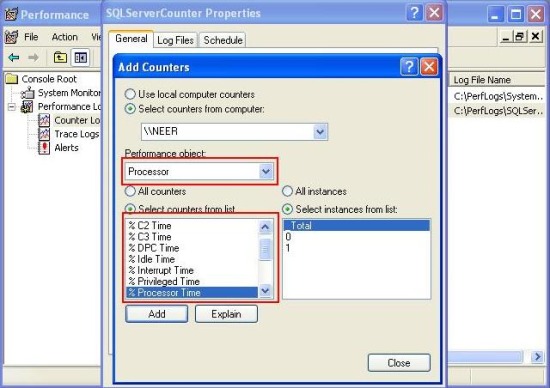
Click on the “Add Counters” button to select the preferred counters in the newly created counter log.
Figure : Add counters for the Performane counter log
Add the preferred counters by selecting desired objects and their corresponding counters from the list. Click on “Close” when done.
Figure : Specify objects and corresponding counters
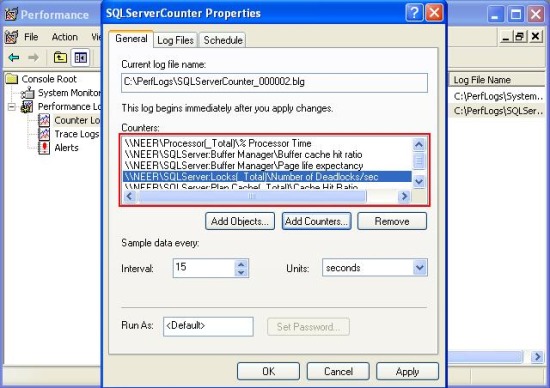
The selected counters will be displayed in the form
Figure : Specify counters
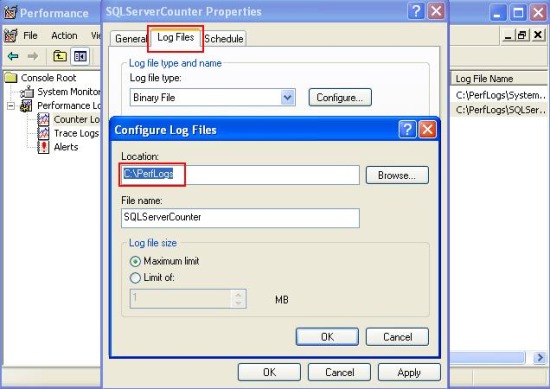
Click on the Log Files tab and click on the “Configure” tab to specify the log file location and modify log file name if required. Click “OK” when done.
Figure : Specify Performance counter log location
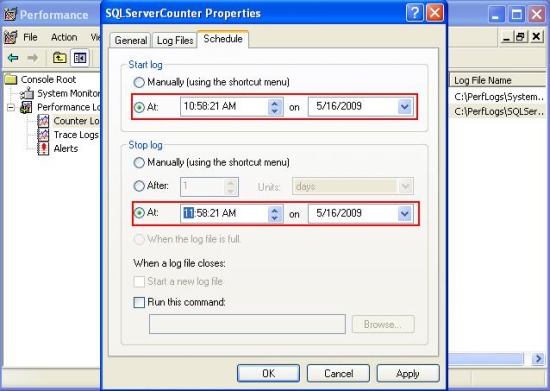
Click on the “Schedule” tab to specify a schedule for reading the counter information and write in the log file. Optionally, you can also select “Manually” for “Start log” and “Stop log” options in which case, the counter data will be logged after you start the performance counter log
Figure : Scheduling the Performance coutner log operation
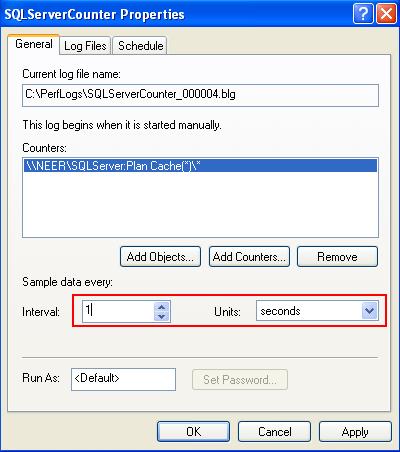
Click on the “General” tab and specify the interval for gathering counter data
Figure : Setting counter sample interval
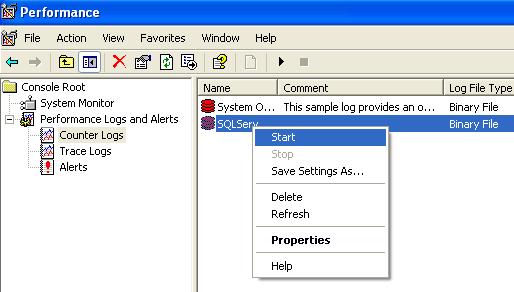
Press “OK” and start performance counter log by selecting the counter log and clicking start. When done, stop the counter log.
Figure : Starting the Performance counter logging
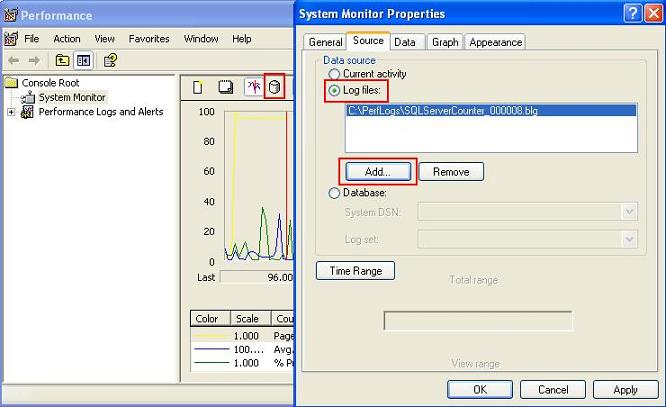
For viewing log data close and open the Performance monitor tool again. Click on the view log icon (The icon in the red box) to view counter log. Click on the “Source” tab and select “Log files” radio button and add the log file to view by clicking on the “Add button”.
Figure : Viewing Performance coutner log
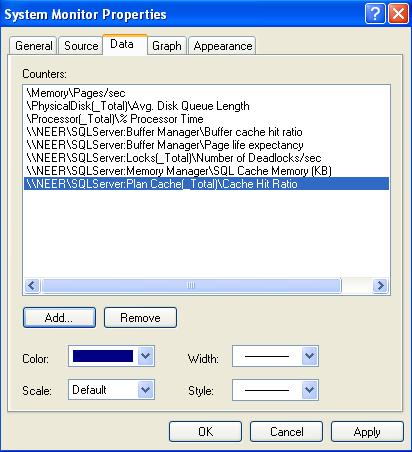
By default, only three default counters are selected to be shown in the counter log output. Specify other counters (That were included while creating the Coutner log) by clicking on the “Data” tab and selecting the desired counters by clicking on the “Add” button.
Figure : Specifying coutners to view data in log
Click “OK” button to view the performance counter log output in a graphical view
Figure : Viewing the Performance coutner log
Correlate Performance counter log and SQL Profiler trace for better investigation
The SQL Profiler can give you information about the long running queries, but, it cannot provide you with the context information to explain the reason for long query execution time.
On the other hand, the Performance monitor tool gives you statistics regarding the individual component’s performance (Context information) but, it does not give you information regarding the query execution time.
So, by combining the performance counter log with the SQL Profiler trace you can get the complete picture while diagnosing performance problems in SQL Server.
Correlating these two things serve another important purpose also. If the same query takes longer time in production server to execute, but, takes shorter time in test server, that indicates the test server may not have the same amount of load, environment and query execution context as the production server has. So, to diagnose the performance problem, you need a way to simulate the Production server’s query execution context in the Test server somehow. You can do this by correlating the SQL Profiler trace at the Test server with the Performance counter log that is taken at the Production server (Obviously, the SQL Profiler trace and Performance counter log that are taken within a same time period can only be correlated).
Correlating these two tool’s output can help you identifying the exact root cause of the performance problem. For example, you might find that each time the query takes 10 seconds to execute in the Production server, the CPU utilization reaches up to 100%. So, instead of trying to tune the SQL, you should investigate the reason why the CPU utilization rises up to 100% to optimize the query performance.
Follow these steps to correlate the SQL Profiler trace with the Performance counter log
Create a Performance Counter log by incorporating the following common performance counters. Specify “Manual” option for starting and stopping the counter log.
Create the performance counter log, but, don’t start it.
Using the SQL Profiler, create a trace using the TSQL Duration template (For simplicity). Add “Start Time” and “End Time” column to the trace and Start the Profiler trace and the Performance counter log created in the previous step at the same time.
When enough tracing has been done, stop both SQL Profiler trace and the Performance counter log at the same time. Save the SQL Profiler trace as a .trc file in the file system.
Close the SQL Profiler trace window and open the trace file again with the Profiler s(.trc file) that was saved in the previous step (Yes, you have to close the Profiler trace and open the trace file again, otherwise, you won’t get the “Import Performance Data” option enabled. This looks like a bug in the Management Studio). Click on the “File->Import Performance Data” to correlate the Performance Counter log with the SQL Profiler trace. (If the Import Performance Data option is disabled, something is wrong and review your steps from the beginning). A file browser window will appear and select the Performance counter log file in the file system that is to be correlated.
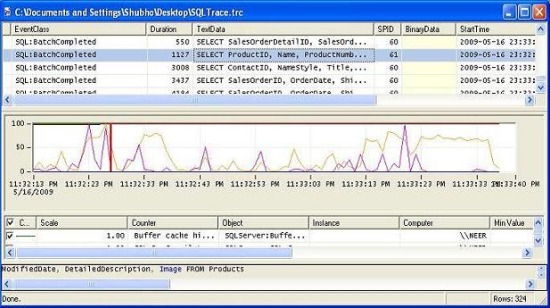
A window will appear to select the counters to correlate. Select all counters and press “OK”. You will be presented with a screen like the below that is the correlated output of SQL Profiler trace and Performance Counter log.
Figure : Correlated output of SQL Profiler and Performance Monitor tool
Click on a particular TSQL in the Profiler trace output (In the upper part of the window). You’ll see that, a Red vertical bar will be set in the Performance counter log output to indicate the particular counter statistics when that particular query was being executed. Similarly, click on the Performance counter log output any where you see a certain performance counter’s value is high (Or, above the normal value). You’ll see that, the corresponding TSQL that was being executed on the database server will be highlighted in the SQL Profiler trace output.
I bet, you’ll surely find correlating these two tools output extremely interesting and handy.
Last words
There are a bunch of tools and techniques available for diagnosing performance problems in SQL Server. For example, you may like to review the SQL Server log file when any such problems are reported. Also, you may like to use the Database Tuning Advisor (DTA) for getting tuning suggestions for optimizing the database. Whatever the tool you use, you need to be able to take a deep look into the internal details to understand what’s going on behind the seen. Once you identify the actual cause of the performance problem, solution is the easiest part most of the cases.
I assume we have sufficient knowledge on diagnosing performance problems in SQL Server so far, along with the optimization steps that we’ve gone through. We are now heading towards the last part of this series of articles. Our optimization mission is going to be ended in the following next article:
"Top 10 steps to optimize data access in SQL Server. Part V (Optimize database files and apply partitioning)"
We are in the process of optimizing an SQL Server database, and so far we have done lots of things. We applied indexing in our database tables and then re-factored the TSQL’s to optimize the data access routines. If you are wondering where we did all these and what are the things we have exactly done, take a look at the following articles in this series:
So, you did all these and still having performance problems with your database? Let me tell you one thing. Even after you have applied proper indexing along with re-factoring your TSQLs with best practices, some data access routines might still be there, which would be expensive, in terms of their execution time. There must have been some smart ways to deal with these.
Yes there are. SQL server offers you some rich indexing techniques that you might have not used earlier. These could surprise you with the performance benefits they possibly offer. Let us start implementing those advanced indexing techniques:
Step6 : Apply some advanced indexing techniques
Implement computed columns and create index on these
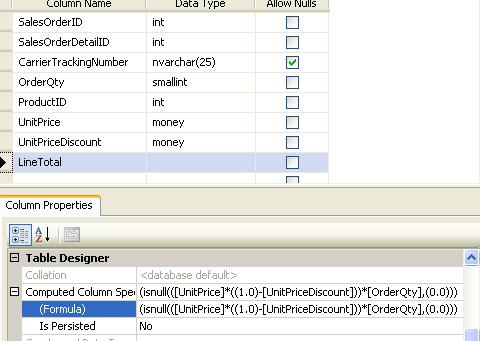
You might have written application codes where you select a result set from the database, and, do a calculation for each rows in the result set to produce the ultimate information to show in the output. For example, you might have a query that retrieves Order information from the database and in the application you might have written codes to calculate the total Order prices by doing arithmetic operations on Product and Sales data). But, why don’t you do all these processing in the database?
Take a look at the following figure. You can specify a database column as a “Computed column” by specifying a formula. While your TSQL includes the computed column in the select list, the SQL engine will apply the formula to derive the value for this column. So, while executing the query, the database engine will calculate the Order total price and return the result for the computed column.
Figure : Computed Column
Sounds good. Using a computed column in this way would allow you to do the entire calculation in the back-end. But sometimes, this might be expensive if the table contains large number of rows and the computed column. The situation might get worse if the computed column is specified in the Where clause in a Select statement. In this case, to match the specified value in the Where clause, the database engine has to calculate computed column’s value for each row in the table. This is a very inefficient process because it always requires a table or full clustered index scan.
So, we need to improve performance on computed columns. How? The solution is, you need to create index on the computed columns. When an index is built on a computed column, SQL Server calculates the result in advance, and builds an index over them. Additionally, when the corresponding column values are updated (That the computed column depends on), the index values on computed column are also updated. So, while executing the query, the database engine does not have to execute the computation formula for every row in the result set. Rather, the pre-calculated values for the computed column are just get selected and returned from the index. As a result, creating index on computed column gives you excellent performance boost.
Note : If you want to create index on a computed column, you must make sure that, the computed column formula does not contain any “nondeterministic” function (For example, getdate() is a nondeterministic function because, each time you call it, it returns a different value).
Create "Indexed Views"
Did you know that you can create indexes on views (With some restrictions)? Well, if you have come this far, let us learn the indexed Views!
Why do we use Views?
As we all know, Views are nothing but compiled Select statements residing as the objects in the database. If you implement your common and expensive TSQLs using Views, it’s obvious that, you can re-use these across your data access routines. Doing this will enable you to join the Views with the other tables/views to produce an output result set, and, the database engine will merge the view definition with the SQL you provide, and, will generated an execution plan to execute. Thus, sometimes Views allow you to re-use common complex Select queries across your data access routines, and also let the database engine re-use execution plans for some portion of your TSQLs.
Take my words. Views don’t give you any significant performance benefits. In my early SQL days, when I first learned about views, I got exited thinking that, Views were something that “remembers” the result for the complex Select query it is built upon. But, soon I was disappointed to know that, Views are nothing but compiled queries, and Views just can’t remember any result set. (Poor me! I can bet, many of you got the same wrong idea about Views, in your first SQL days).
But now, I may have a surprise for you! You can do something on a View so that, it can truly “remembers” the result set for the Select query it is compost of. How? It’s not hard; you just have to create indexes on the View.
Well, if you apply indexing on a View, the View becomes an “Indexed view”. For an indexed View, the database engine processes the SQL and stores the result in the data file just like a clustered table. SQL Server automatically maintains the index when data in the base table changes. So, when you issue a Select query on the indexed View, the database engine simply selects values from an index which obviously performs very fast. Thus, creating indexes on views gives you excellent performance benefits.
Please note that, nothing comes free. As creating Indexed Views gives you performance boost, when data in the base table changes, the database engine has to update the index also. So, you should consider creating indexed Views when the view has to process too many rows with aggregate function, and when data and the base table do not change often.
How to create indexed View?
Create/modify the view with specifying the SCHEMABINDING option
Collapse
CreateVIEW dbo.vOrderDetails
WITH SCHEMABINDING
AS
Select…
Create a unique clustered index on the View
Create non-clustered index on the View as required
Wait! Don’t get too much exited about indexed Views. You can’t always create indexes on Views. Following are the restrictions:
The View has to be created with SCHEMABINDING option. In this case, the database engine will not allow you to change the underlying table schema.
The View cannot contain any nondeterministic function, DISTINCT clause and subquery.
The underlying tables in the View must have clustered index (Primary keys)
So, try finding the expensive TSQLs in your application that are already implemented using Views, or, that could be implemented using Views. Try creating indexes on these Views to boost up your data access performance.
Create indexes on User Defined Functions (UDF)
Did you know this? You can create indexes on User Defined Functions too in SQL Server. But, you can’t do this in a straight-forward way. To create index on a UDF, you have to create a computed column specifying an UDF as the formula and then you have to create index on the computed column field.
Here are the steps to follow:
Create the function (If not exists already) and make sure that, the function (That you want to create index on) is deterministic. Add SCHEMABINDING option in the function definition and make sure that there is no non-deterministic function/operator (getdate(), or, distinct etc) in the function definition.
For example,
Collapse
CreateFUNCTION [dbo.ufnGetLineTotal]
(
-- Add the parameters for the function here
@UnitPrice [money],
@UnitPriceDiscount [money],
@OrderQty [smallint]
)
RETURNS moneyWITH SCHEMABINDING
ASBEGINreturn (((@UnitPrice*((1.0)-@UnitPriceDiscount))*@OrderQty))
END
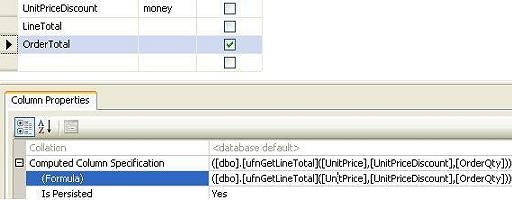
Add a computed column in your desired table and specify the function with parameters as the value of the computed column.
Collapse
Create FUNCTION [dbo.ufnGetLineTotal]
(
-- Add the parameters for the function here
@UnitPrice [money],
@UnitPriceDiscount [money],
@OrderQty [smallint]
)
RETURNS money
WITH SCHEMABINDING
AS
BEGIN
return (((@UnitPrice*((1.0)-@UnitPriceDiscount))*@OrderQty))
END
Figure : Specifying UDF as computation formula for computed column
Create an index on the computed column
We already have seen that we can create index on computed columns to retrieve faster results on computed columns. But, what benefit could be achieved by using UDF in the computed columns and creating index on those?
Well, doing this would give you a tremendous performance benefit when you include the UDF in a query, especially if you use UDFs in the join conditions between different tables/views. I have seen lots of join queries written using UDFs in the joining conditions. I’ve always thought UDFs in join conditions are bound to be slow (If number of results to process is significantly large) and there has to be a way to optimize it. Creating indexes on functions in the computed columns is the solution.
Create indexes on XML columns
Create indexes on XML columns if there is any. XML columns are stored as binary large objects (BLOBs) in SQL server (SQL server 2005 and later) which can be queried using XQuery, but querying XML data types can be very time consuming without an index. This is true especially for large XML instances because SQL Server has to shred the binary large object containing the XML at runtime to evaluate the query.
To improve query performance on XML data types, XML columns can be indexed. XML indexes fall in two categories:
Primary XML indexes
When the primary index on XML column is created, SQL Server shreds the XML content and creates several rows of data that include information like element and attribute names, the path to the root, node types and values, and so on. So, creating the primary index enable the SQL server to support XQuery requests more easily.
Following is the syntax for creating primary XML index:
Collapse
CreatePRIMARY XML INDEX
index_name
ON <object> ( xml_column )
Secondary XML indexes.
Creating the primary XML indexes improves XQuery performance because the XML data is shredded already. But, SQL Server still needs to scan through the shredded data to find the desired result. To further improve query performance, the secondary XML index should be created on top of primary XML indexes.
Three types of secondary XML indexes are there. These are:
“Path” Secondary XML indexes: Useful when using the .exist() methods to determine whether a specific path exists.
“Value” Secondary XML indexes: Used when performing value-based queries where the full path is unknown or includes wildcards.
“Property” Secondary XML indexes: Used to retrieve property values when the path to the value is known.
Following is the syntax for creating the secondary XML indexes
Collapse
Create XML INDEX
index_name
ON <object> ( xml_column )
USING XML INDEX primary_xml_index_name
FOR { VALUE | PATH | PROPERTY }
Please note that, the above guidelines are the basics. But, creating indexes blindly on each and every tables on the mentioned columns may not always result in performance optimization, because, sometimes, you may find that, creating indexes on some particular columns in some particular tables resulting in making the data insert/update operations in that table slower (Particularly, if the table has a low selectivity on a column)., Also if the table is a small one containing small number of rows (Say, <500), creating index on the table might in turn increase the data retrieval performance (Because, for smaller tables, a table scan is faster). So, we should be judicious while determining the columns to create indexes on.
Step7:Apply de-normalizations, use history tables and pre-calculated columns
De-normalization
If you are designing a database for an OLTA system (Online Transaction Analytical system that is mainly a data warehouse which is optimized for read-only queries), you can (and, should) apply heavy de-normalizing and indexing in your database. That is, same data will be stored across different tables, but, the reporting and data analytical queries would run very fast on these kinds of databases.
But, if you are designing a database for an OLTP system (Online Transaction Processing System that is mainly a transactional system where mostly data update operations take place (That is, Insert/Update/Delete operations which we are used to work with most of the times), you are advised to implement at least 1st, 2nd and 3rd Normal forms so that, you can minimize data redundancy and thus, minimize data storage and increase manageability.
Despite the fact that we should apply normalizations in an OLTP system, we usually have to run lots of read operations (Select queries) on the database. So, after applying all optimization techniques so far, if you find that some of your data retrieval operations still not performing efficiently, you need to consider applying some sort of de-normalizations. So, the question is, how should you apply de-normalization and why this would improve performance?
Let us see a simple example to find the answer
Let’s say we have two tables OrderDetails(ID,ProductID,OrderQty) and Products(ID,ProductName) that stores order Detail information and Product Information respectively. Now to select the Product names with their ordered quantity for a particular order, we need to issue the following query that requires joining the OrderDetails and Products table.
Collapse
Select Products.ProductName,OrderQty
FROM orderDetails INNERJOIN Products
ON orderDetails.ProductID = Products.ProductID
Where SalesOrderID = 47057
Now, if these two tables contain huge number of rows, and, if you find that, the query is still performing slowly even after applying all optimization steps, you can apply some de-normalization as follows:
Add the column ProductName to the OrderDetails table and populate the ProductName column values
Rewrite the above query as follows:
Collapse
Select ProductName,OrderQty
FROM orderDetails
Where SalesOrderID = 47057
Please note that, after applying de-normalization in the OrderDetails table, you no longer need to join the OrderDetails table with the Products table to retrieve Product names and their ordered quantity. So, while executing the SQL, the execution engine does not have to process any joining between the two tables. So, the query performs relatively faster.
Please note that, in order to improve the select operation’s performance, we had to do a sacrifice. The sacrifice was, we had to store the same data (ProductName) in two places (In OrderDetails and Products Table). So, while we insert/update the ProductName field in Products table, we also have to do the same in the OrderDetails Table. Additionally, doing this de-normalization will increase the overall data storage.
So, while de-normalizing, we have to do some trade-offs between the data redundancy and select operation’s performance. Also, we have to re-factor some of our data insert/update operations after applying the de-normalization. Please be sure to apply de-normalization only if you have applied all other optimization steps and yet to boost up the data access performance. Also, make sure that you don’t apply heavy de-normalizations so that, your basic data design does not get destroyed. Apply de-normalization (When required) only on the key tables that are involved in the expensive data access routines.
History tables
In your application if you have some data retrieval operations (Say, reporting) that periodically runs on a time period, and, if the process involves tables that are large in size having normalized structure, you can consider moving data periodically from your transactional normalized tables into a de-normalized heavily indexed single history table. You also can create a scheduled operation in your database server that would populate this history table on a specified time each day. If you do this, the periodic data retrieval operation than has to read data only from a single table that is heavily indexed, and, the operation would perform a lot faster.
For example, let’s say a chain store has a monthly sales reporting process that takes 3 hours to complete. You are assigned to minimize the time it takes, and to do this you can follow these steps (Along with performing other optimization steps):
Create a history table with de-normalized structure and heavy indexing to store sales data.
Create a scheduled operation in SQL server that runs each 24 hours interval (Midnight) and specify an SQL for the scheduled operation to populate the history table from the transactional tables.
Modify your reporting codes so that if reads data from the history table now.
Creating the scheduled operation
Follow these simple steps to create a scheduled operation in SQL Server that periodically populates a history table on a specified schedule.
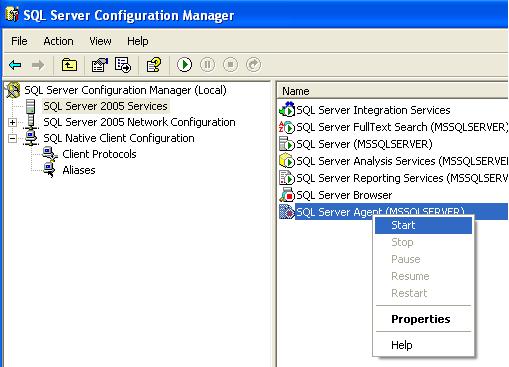
Make sure that, SQL Server Agent is running. To do this, launch the SQL Server Configuration Manager, click on the SQL Server 2005 Services and start the SQL Server Agent by right clicking on it.
Figure : Starting SQL Server Agent Service
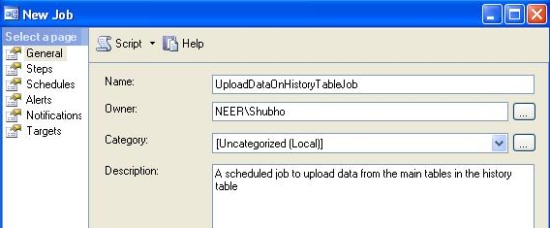
Expand SQL Server Agent node in the object explorer and click on the “Job” node to create a new job. In the General tab, provide job name and descriptions.
Figure : Creating a new Job
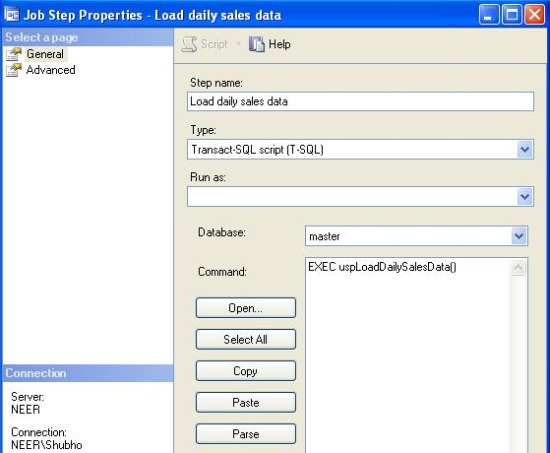
On the “Steps” tab, click on the “New” button to create a new job step. Provide a name for the step and also provide TSQL (That would load the history table with the daily sales data) along with providing Type as “Transact-SQL script(T-SQL)”. Press “OK” to save the Step.
Figure : Job step to load daily sales data on history table
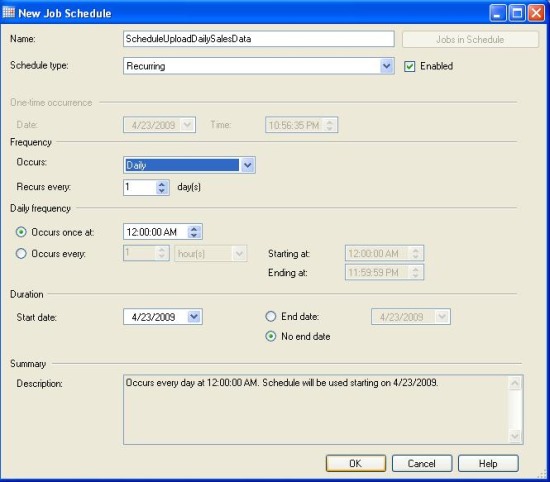
Go to the “Schedule” tab and click on “New” button to specify a job schedule.
Figure : Specifying job schedule.
Click the “OK” button to save the schedule and also to apply the schedule on the specified job.
Perform expensive calculations in advance in data Insert/Update, simplify Select query
Naturally, most of the cases in your application you will see that data insert/update operations occur one by one, for each record. But, data retrieval/read operations involve multiple records at a time.
So, if you have a slowly running read operation (Select query) that has to do complex calculations to determine a resultant value for each row in the big result set, you can consider doing the following:
Create an additional column in a table that will contain the calculated value
Create a trigger for Insert/Update events on this table and calculate the value there using the same calculation logic that was in the select query earlier. After calculation, update the newly added column value with the calculated value.
Replace the existing calculation logic from your select query with the newly created field
After implementing the above steps, the insert/update operation for each record in the table will be a bit slower (Because, the trigger will now be executed to calculate a resultant value), but, the data retrieval operation should run faster than previous. The reason is obvious, while the Select query executes, the database engine does not have to process the expensive calculation logic any more for each row.
What’s next?
Iwish you have enjoyed all the optimization steps done so far. We have gone through indexing, refactoring the TSQLs, applying some advanced indexing techniques, de-normalizing portion of the database and using History tables to speed up our data access routines. Having done all of the above steps should bring your data access operations to a satisfactory level, but, we are not satisfied yet (Are we?).
So, we are going to do many more things to do further optimizations in our data access operations. Let's go through the next article in this series:
“It’s been months since you and your team have developed and deployed a site successfully in the internet. You have a pretty satisfied client so far as the site was able to attract thousands of users to register and use the site within a small amount of time. Your client, management, team and you – everybody is happy.
Life is not a bed of roses. As the number of users in the site was started growing at a rapid rate day by day, problem started occurring. E-mails started to arrive from the client complaining that the site is performing too slowly (Some of them ware angry mails). The client claimed that, they started losing users.
You started investigating the application. Soon you discovered that, the production database was performing extremely slowly when application was trying to access/update data. Looking into the database you found that the database tables have grown large in size and some of them were containing hundreds of thousands of rows. The testing team performed a test on the production site and they found that the order submission process was taking 5 long minutes to complete whereas it used to take only 2/3 seconds to complete in the test site before production launch”.
This is the same old story for thousands of application projects developed worldwide. Almost every developer including me has taken part in the story sometime in his/her development life. So, I know why such situation took place, and, I can tell you what to do to overcome this.
Let’s face it. If you are part of this story, you must have not written the data access routines in your application in the best possible way and it’s time to optimize those now. I want to help you doing this by sharing my data access optimization experiences and findings with you in this series of articles. I just hope, this might enable you to optimize your data access routines in the existing systems, or, to develop the data access routines in the optimized way in your future projects.
Scope
Please note that, the primary focus of these series of articles is “Data access performance optimization in transactional (OLTP) SQL Server databases”. But, most of the optimization techniques are roughly the same for other database platforms.
Also, the optimization techniques I am going to discuss are applicable for the software application developers only. That is, as a developer, I’ll focus on the issues that you need to follow to make sure that you have done everything that you could do to optimize the data access codes you have written or you are going to write in future. The Database Administrators (DBA) also has great roles to play in optimizing and tuning the database performance. But, optimization scopes that fall into a DBA’s area are out of scope for these articles.
We have a database to optimize, let’s start it!
When a database based application performs slowly, there is a 90% probability that, the data access routines of that application are not optimized, or, not written in the best possible way. So, you need to review and optimize your data access/manipulation routines for improving the overall application’s performance.
So, let us start our optimization mission in a step-by-step process:
Step1: Apply proper indexing in the table columns in the database
Well, some could argue whether implementing proper indexing should be the first step in performance optimization process in the database. But, I would prefer applying indexing properly in the database in the first place, because of following two reasons:
This will allow you to improve the best possible performance in the quickest amount of time in a production system.
Applying/creating indexes in the database will not require you to do any application modification and thus will not require any build and deployment.
Of course, this quick performance improvement can be achieved if you find that, indexing is not properly done in the current database. However, if indexing is already done, I would still recommend you to go through this step.
What is indexing?
I believe, you know what indexing is. But, I’ve seen many people being unclear on this. So, let us try to understand indexing once again. Lets us read a small story.
Long ago there was a big library in an ancient city. It had thousands of books, but, the books ware not arranged in any order in the book shelves. So, each time a person asked for a book to the librarian, the librarian had no way but to check every book to find the required book that the person wants. Finding the desired book used to take hours for the librarian, and, most of the times the persons who ask for books had to wait for a long time.
[Hm..seems like a table that has no primary key. So, when any data is searched in the table, the database engine has to scan through the entire table to find the corresponding row, which performs very slow.]
Life was getting miserable for that librarian as the number of books and persons asking for books were increasing day by day. Then one day, a wise guy came to the library, and, seeing the librarian’s measurable life, he advised him to number each book and arrange these in the book shelves according to their numbers. “What benefit would I get?” Asked the librarian. The wise guy answered, “well, now if somebody gives you a book number and ask for that book, you will be able to find the shelves quickly that contains the book’s number, and, within that shelve, you can find that book very quickly as these are arranged according to their number”.
[Numbering the books sounds like creating primary key in a database table. When you create a primary key in a table, a clustered index tree is created and all data pages containing the table rows are physically sorted in the file system according to their primary key values. Each data page contains rows which are also sorted within the data page according to their primary key values. So, each time you ask any row from the table, the database server finds the corresponding data page first using the clustered index tree (Like, finding the book shelve first) and then finds the desired row within the data page that contains the primary key value (Like, finding the book within the shelve)]
“This is what I exactly need!” The excited librarian instantly starts numbering the books and arranging these across different book shelves. He spent a whole day to do this arrangement, but, at the end of the day, he tested and found that that a book now could be found using the number within no time at all! The librarian was extremely happy.
[That’s exactly what happens when you create a primary key in a table. Internally, a clustered index tree is created, and, the data pages are physically sorted within the data file according to the primary key values. As you can easily understand, only one clustered index can be created for a table as the data can be physically arranged only using one column value as the criteria (Primary key). It’s like the books can only be arranged using one criterion (Book number here)]
Wait! The problem was not completely solved yet. In the very next day, a person asked a book by the book’s name (He didn’t have the book’s number, so, all he had the book’s name). The poor librarian had no way but to scan all numbered book from 1 to N to find the one the person asked for. He found the book in the 67th shelves. It took 20 minutes for the librarian to find the book. Earlier, he used to take 2-3 hours to find a book when these were not arranged in the shelves, so, that’s an improvement still. But, comparing to the time to search a book using it’s number (30 seconds), this 20 minute seemed to be a very high amount of time to the librarian. So, he asked the wise man how to improve on this.
[This happens when you have a Product table where you have a primary key ProductID, but, you have no other index in the table. So, when a product is to be searched using the Product Name, the database engine has no way but to scan all physically sorted data pages in the file to find the desired named book]
The wise man told the librarian “Well, as you already have arranged your books using their serial numbers, you cannot re-arrange these. So, better create a catalog or index where you will have all the book’s names and their corresponding serial numbers. But, in this catalog, arrange the book names in their alphabetic number and group the book names using each alphabet so that, if any one wants to find a book named “Database Management System”, you just follow these steps to find the book
Jump into the section “D” of your “Book name “catalog” and find the book name there
Read the corresponding serial number of the book and find the book using the serial number (You already know how to do this)
“You are a genius! Exclaimed the librarian. Spending some hours he immediately created the “Book name” catalog and on a quick test he found that he only required 1 minute (30 seconds to find the book’s serial number in the “Book name” catalog and another 30 seconds to find the book using the serial number) to find a book using the book name.
The librarian thought that, people might ask for books using several other criteria like book name and/or author’s name etc. so, he created another similar catalog for author names and after creating these catalogs the librarian could find any book using the some common book finding criteria (Serial number, Book name, Author’s name) within a maximum 1 minute of time. The miseries of the librarian ended soon and lots of persons started gathering at the library for books as they could get the book really fast and the library became very popular.
The librarian started passing his life happily ever after. The story ends.
By this time, I am sure you have understood what indexes really are, why they are important and what their inner workings are. For example if we have a “Products” table, along with creating a clustered index (That is automatically created when creating the primary key in the table), we should create a non-clustered index on the ProductName column. If we do this, the database engine creates an index tree for the non-clustered index (Like, the “book name” catalog in the story) where the product names will be sorted within the index pages. Each index page will contain some range of product names along with their corresponding primary key values. So, when a Product is searched using the product name in the search criteria, the database engine will first seeks the non-clustered index tree for Product name to find the primary key value of the book. Once found, the database engine then searches the clustered index tree with the primary key to find the row for the actual book that is being searched.
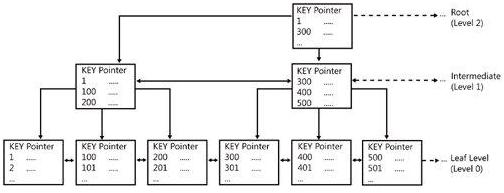
Following is how an index tree looks like:
Figure : Index tree structure
This is called a B+ Tree (Balanced tree). The intermediate nodes contain range of values and direct the SQL engine where to go while searching for a specific index value in the tree starting from the root node. The leaf nodes are the nodes which contain the actual index values. If this is a clustered index tree, the leaf nodes are the physical data pages. If this is a non-clustered index tree, the leaf nodes contain index values along with clustered index keys (Which the database engine uses to find the corresponding row in the clustered index tree.
Usually, finding a desired value in the index tree and jumping to the actual row from there takes an extremely small amount of time for the database engine. So, indexing generally improves the data retrieval operations.
So, time to apply indexing in your database to retrieve results fast!
Follow these steps to ensure proper indexing in your database
Make sure that every table in your database has a primary key.
This will ensure that every table has a Clustered index created (And hence, the corresponding pages of the table are physically sorted in the disk according to the primary key field). So, any data retrieval operation from the table using primary key, or, any sorting operation on the primary key field or any range of primary key value specified in the where clause will retrieve data from the table very fast.
Create non-clustered indexes on columns which are:
Frequently used in the search criteria
Used to join other tables
Used as foreign key fields
Of having high selectivity (Column which returns a low percentage (0-5%) of rows from a total number of rows on a particular value)
Used in the orDER BY clause
Of type XML (Primary and secondary indexes need to be created. More on this in the coming articles)
Following is an example of an index creation command on a table:
Collapse
CreateINDEX
NCLIX_OrderDetails_ProductID ON
dbo.OrderDetails(ProductID)
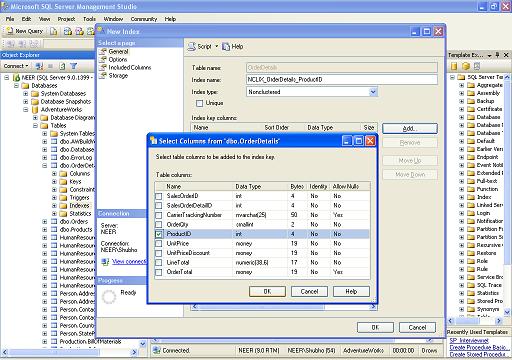
Alternatively, you can use the SQL Server Management Studio to create index on the desired table
Figure : Creating index using SQL Server Management Studio
Step2 : Create appropriate covering indexes
So, you have created all appropriate indexes in your database, right? Suppose, in this process you have created an index on a foreign key column (ProductID) in the Sales(SelesID,SalesDate,SalesPersonID,ProductID,Qty) table. Now, assuming that, the ProductID column is a “Highly selective” column (Selects less than 5% of the total number of rows rows using any ProductID value in the search criteria) , any Select query that reads data from this table using the indexed column (ProductID) in the where clause should run fast, right?
Yes, it does, comparing to the situation where no index created on the foreign key column (ProductID) in which case, a full table scan (scanning all related pages in the table to retrieve desired data). But, still, there is further scope to improve this query.
Let’s assume that, the Sales table contains 10,000 rows, and, the following SQL selects 400 rows (4% of the total rows)
Collapse
Select SalesDate, SalesPersonID FROM Sales Where ProductID = 112
Let’s try to understand how this SQL gets executed in the SQL execution engine
The Sales table has a non-clustered index on ProductID column. So, it “seeks” the non-clustered index tree for finding the entry that contains ProductID=112
The index page that contains the entry ProductID = 112 also contains the all Clustered index keys (All Primary key values, that is SalesIDs, that have ProductID = 112 assuming that primary key is already created in the Sales table)
For each primary key (400 here), the SQL server engine “seeks” into the clustered index tree to find the actual row locations in the corresponding page.
For each primary key, when found, the SQL server engine selects the SalesDate and SalesPersonID column values from the corresponding rows.
Please note that, in the above steps, for each of the primary key entries (400 here) for ProductID = 112, the SQL server engine has to search the clustered index tree (400 times here) to retrieve the additional columns (SalesDate, SalesPersonID) in the query.
It seems that, along with containing clustered index keys (Primary key values) if the non-clustered index page could also contain two other column values specified in the query (SalesDate, SalesPersonID), the SQL server engine would not have to perform the step 3 and step 4 in the above steps, and, thus, would be able to select the desired results even faster just by “seeking” into the non clustered index tree for ProductID column, and, reading all three mentioned column values directly from that index page.
Fortunately, there is a way to implement this feature. This is what is called “Covered index”. You create “Covered indexes” in table columns to specify what are the additional column values the index page should store along with the clustered index key values (primary keys). Following is the example of creating a covered index on the ProductID column in Sales table:
Collapse
CreateINDEX NCLIX_Sales_ProductID--Index nameON dbo.Sales(ProductID)--Column on which index is to be created
INCLUDE(SalesDate, SalesPersonID)--Additional column values to include
Please note that, Covered index should be created including a few columns that are frequently used in the select queries. Including too many columns in the covered indexes would not give you too much benefit. Rather, doing this would require too much memory to store all the covered index column values resulting in over consumption of memory and slow performance.
Use Database Tuning Advisor’s help while creating covered index
We all know, when an SQL is issued, the optimizer in the SQL server engine dynamically generates different query plans based on:
Volume of Data
Statistics
Index variation
Parameter value in TSQL
Load on server
That means, for a particular SQL, the execution plan generated in the production server may not be the same execution plan that is generated in the test server, even though, the table and index structure is the same. This also indicates that, an index created in the test server might boost some of your TSQL performance in the test application, but, creating the same index in the production database might not give you any performance benefit in the production application! Why? Well, because, the SQL execution plans in the test environment utilizes the newly created indexes and thus gives you better performance. But, the execution plans that are being generated in the production server might not use the newly created index at all for some reasons (For example, a non-clustered index column is not “highly” selective in the production server database, which is not the case in the test server database).
So, while creating indexes, we need to make sure that, the index would be utilized by the execution engine to produce faster result. But, how can we do this?
The answer is, we have to simulate the production server’s load in the test server, and then need to create appropriate indexes and test those. Only then, if the newly created indexes improves performance in the test environment, these will most likely to improve performance in the production environment.
Doing this should be hard, but, fortunately, we have some friendly tools to do this. Follow these instructions:
Use SQL profiler to capture traces in the production server. Use the Tuning template (I know, it is advised not to use SQL profiler in the production database, but, sometimes you have to use it while diagnosing performance problem in the production). If you are not familiar with this tool, or, if you need to learn more about profiling and tracing using SQL profiler, read http://msdn.microsoft.com/en-us/library/ms181091.aspx.
Use the trace file generated in the previous step to create a similar load in the test database server using the Database tuning advisor. Ask the Tuning advisor to give some advice (Index creation advice most of the cases). You are most likely to get good realistic (index creation) advice from the tuning advisor (Because, the Tuning advisor loaded the test database with the trace generated from the production database and then tried to generate best possible indexing suggestion) . Using the Tuning advisor tool, you can also create the indexes that it suggests. If you are not familiar with the Tuning advisor tool, or, if you need to learn more about using the Tuning advisor, read http://msdn.microsoft.com/en-us/library/ms166575.aspx.
Step3 : Defragment indexes if fragmentation occurs
OK, you created all appropriate indexes in your tables. or, may be, indexes are already there in your database tables. But, you might not still get the desired good performance according to your expectation.
There is a strong chance that, index fragmentation have occurred.
What is index fragmentation?
Index fragmentation is a situation where index pages split due to heavy insert, update, and delete operations on the tables in the database. If indexes have high fragmentation, either scanning/seeking the indexes takes much time or the indexes are not used at all (Resulting in table scan) while executing queries. So, data retrieval operations perform slow.
Two types of fragmentation can occur:
Internal Fragmentation: Occurs due to the data deletion/update operation in the index pages which ends up in distribution of data as sparse matrix in the index/data pages (create lots of empty rows in the pages). Also results in increase of index/data pages that increase query execution time.
External Fragmentation: Occurs due to the data insert/update operation in the index/data pages which ends up in page splitting and allocation of new index/data pages that are not contiguous in the file system. That reduces performance in determining query result where ranges are specified in the “where” clauses. Also, the database server cannot take advantage of the read-ahead operations as, the next related data pages are not guaranteed to be contiguous, rather, these next pages could be anywhere in the data file.
How to know whether index fragmentation occurred or not?
Execute the following SQL in your database (The following SQL will work in SQL Server 2005 or later databases. Replace the database name ‘AdventureWorks’ with the target database name in the following query):
Collapse
Select object_name(dt.object_id) Tablename,si.name
IndexName,dt.avg_fragmentation_in_percent AS
ExternalFragmentation,dt.avg_page_space_used_in_percent AS
InternalFragmentation
FROM
(
Select object_id,index_id,avg_fragmentation_in_percent,avg_page_space_used_in_percent
FROM sys.dm_db_index_physical_stats (db_id('AdventureWorks'),null,null,null,'DETAILED'
)
Where index_id <> 0) AS dt INNERJOIN sys.indexes si ON si.object_id=dt.object_id
AND si.index_id=dt.index_id AND dt.avg_fragmentation_in_percent>10
AND dt.avg_page_space_used_in_percent<75 ORDERBY avg_fragmentation_in_percent DESC
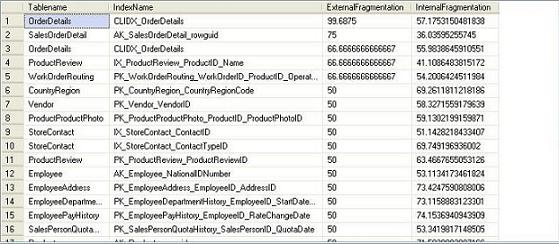
The above query shows index fragmentation information for the ‘AdventureWorks’ database as follows:
Figure : Index fragment information
Analyzing the result, you can determine where index fragmentation have occurred, using the following rules:
ExternalFragmentation value > 10 indicates External fragmentation occurred for corresponding index
InternalFragmentation value < 75 indicates Internal fragmentation occurred for corresponding index
How to defragment indexes?
You can do this in two ways:
Reorganize fragmented indexes: Execute the following command to do this:
Collapse
AlterINDEXALLON TableName REORGANIZE
Rebuild indexes: Execute the following command to do this:
Collapse
AlterINDEXALLON TableName REBUILD WITH (FILLFACTOR=90,ONLINE=ON)
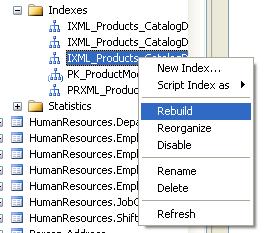
You can also rebuild or reorganize individual indexes in the tables by using the index name instead of the ‘ALL’ keyword in the above queries. Alternatively, you can also use the SQL Server Management Studio to do index defragmentation.
Figure : Rebuilding index using SQL Server Management Studio
When to reorganize and when to rebuild indexes?
You should “Reorganize” indexes when the External Fragmentation value for the corresponding index is in between 10-15 and Internal Fragmentation value is in between 60-75. Otherwise, you should rebuild indexes.
One important thing with index rebuilding is, while rebuilding indexes for a particular table, the entire table will be locked (Which does not occur in case of index reorganization). So, for a large table in the production database, this locking may not be desired, because, rebuilding indexes for that table might take hours to complete. Fortunately, in SQL Server 2005, there is a solution. You can use the ONLINE option as ON while rebuilding indexes for a table (See index rebuild command given above). This will rebuild the indexes for the table along with making the table available for transactions.
Last words
It's really tempting to create index on all eligible columns in your database tables. But, if you are working with a transactional database (An OLTP system where update operations take place most of the times), creating indexes on all eligible columns might not be desirable every time. In fact, creating heavy indexing on OLTP systems might reduce overall database performance (As most operations are update operations, updating data means updating indexes as well).
A rule of thumb can be suggested as follows: If you work on a transactional database, you should not create more than 5 indexes on the tables on an average. On the other hand, if you work on a Data warehouse application, you should be able to create up to 10 indexes on the tables on an average.
What's next?
Applying indexing properly in your database would enable you to increase performance a lot, in a quick amount of time. But there are lots of other things you should do to optimize your database, including some advance indexing features in the SQL Server database. These will be covered in the other optimization steps provided in the next articles.
Remember we ware in a mission? Our mission was to optimize the performance of an SQL Server database. We had an application that was built on top of that database. The application was working pretty fine while tested, but, soon after deployment at production, it started to perform slowly as the data volume was increased in the database. Within a very few months, the application started performing so slowly that, the poor developers (including me) had to start this mission to optimize the database and thus, optimize the application.
Please have a look at the previous article to know how it started and what did we do to start the optimization process.
Well, in the first 3 steps (Discussed in the previous article), we had implemented indexing in our database. That was because; we had to do something that improves the database performance in a quick amount of time, with a least amount of effort. But, what if we wrote the data access codes in an inefficient way? What if we wrote the TSQLs poorly?
Applying indexing will obviously improve the data access performance, but, at the most basic level in any data access optimization process, you have to make sure that you have written your data access codes and TSQLs in the most efficient manner, applying the best practices.
So, in this article, we are going to focus on writing or refactoring the data access codes using the best practices. But, before we start playing the game, we need to prepare the ground first. So let’s do the groundwork at this very next step:
Step4: Move TSQL codes from application into the database server
I know you may not like this suggestion at all. You might have used an orM that does generate all the SQLs for you on the fly. or, you or your team might have a “principle” of keeping SQLs in your application codes (In the Data access layer methods). But, still, if you need to optimize the data access performance, or, if you need to troubleshoot a performance problem in your application, I would suggest you to move your SQL codes into your database server (Using Stored procedure, Views, Functions and Triggers) from your application. Why? Well, I do have some strong reasons for this recommendation:
Moving the SQLs from application and implementing these using stored procedures/Views/Functions/Triggers will enable you to eliminate any duplicate SQLs in your application. This will also ensure re-usability of your TSQL codes.
Implementing all TSQLs using the database objects will enable you to analyze the TSQLs more easily to find possible inefficient codes that are responsible for slow performance. Also, this will let you manage your TSQL codes from a central point.
Doing this will also enable you to re-factor your TSQL codes to take advantage of some advanced indexing techniques (going to be discussed in later parts in this series of articles). Also, this will help you to write more “Set based” SQLs along with eliminating any “Procedural” SQLs that you might have already written in your application.
Despite the fact that indexing (In Step1 to Step3) will let you troubleshoot the performance problems in your application in a quick time (if properly done), following this step 4 might not give you a real performance boost instantly. But, this will mainly enable you to perform other subsequent optimization steps and apply different other techniques easily to further optimize your data access routines.
If you have used an orM (Say, NHibernate) to implement the data access routines in your application, you might find your application performing quite well in your development and test environment. But, if you face performance problem in a production system where lots of transactions take place each second, and where too many concurrent database connections are there, in order to optimize your application’s performance you might have to re-think with your orM based data access logics. It is possible to optimize an orM based data access routines, but, it is always true that if you implement your data access routines using the TSQL objects in your database, you have the maximum opportunity to optimize your database.
If you have come this far while trying to optimize your application’s data access performance, come on, convince your management and purchase some time to implement a TSQL object based data operational logic. I can promise you, spending one or two man-month doing this might save you a man-year in the long run!
OK, let’s assume that you have implemented your data operational routines using the TSQL objects in your database. So, having done this step, you are done with the “ground work” and ready to start playing. So, let’s move towards the most important step in our optimization adventure. We are going to re-factor our data access codes and apply the best practices.
Step5: Identify inefficient TSQLs, re-factor and apply best practices
No matter how good indexing you apply in your database, if you use poorly written data retrieval/access logic, you are bound to get slow performance.
We all want to write good codes, don’t we? While we write data access routines for a particular requirement, we really have lots of options to follow for implementing particular data access routines (And application’s business logics). But, most of the cases, we have to work in a team with members of different calibers, experience and ideologies. So, while at development, there are strong chances that our team members may write codes in different ways and some of them miss following the best practices. While writing codes, we all want to “get the job done” first (Most of the cases). But, while our codes run in production, we start to see the problems.
Time to re-factor those codes now. Time to implement the best practices in your codes.
I do have some SQL best practices for you that you can follow. But, I am sure that you already know most of them. Problem is, in reality, you just don’t implement these good stuffs in your code (Of course, you always have some good reasons for not doing so). But what happens, at the end of the day, your code runs slowly and your client becomes unhappy.
So, knowing the best practices is not enough at all. The most important part is, you have to make sure that you follow the best practices while writing TSQLs. This is the most important thing.
Some TSQL Best practices
Don’t use “Select*" in SQL Query
Unnecessary columns may get fetched that adds expense to the data retrieval time.
The Database engine cannot utilize the benefit of “Covered Index” (Discussed in the previous article), hence, query performs slowly.
Avoid unnecessary columns in Select list and unnecessary tables in join conditions
Selecting unnecessary columns in select query adds overhead to the actual query, specially if the unnecessary columns are of LOB types.
Including unnecessary tables in the join conditions forces the database engine to retrieve and fetch unnecessary data that and increase the query execution time.
Do not use the COUNT() aggregate in a subquery to do an existence check:
Do not use
Collapse
Select column_list FROMtableWhere0 < (Select count(*) FROM table2 Where ..)
Instead, use
Collapse
Select column_list FROMtableWhereEXISTS (Select * FROM table2 Where ...)
When you use COUNT(), SQL Server does not know that you are doing an existence check. It counts all matching values, either by doing a table scan or by scanning the smallest nonclustered index.
When you use EXISTS, SQL Server knows you are doing an existence check. When it finds the first matching value, it returns TRUE and stops looking. The same applies to using COUNT() instead of IN or ANY.
Try to avoid joining between two types of columns
When joining between two columns of different data types, one of the columns must be converted to the type of the other. The column whose type is lower is the one that is converted.
If you are joining tables with incompatible types, one of them can use an index, but the query optimizer cannot choose an index on the column that it converts. For example:
Collapse
Select column_list FROM small_table, large_table Where
smalltable.float_column = large_table.int_column
In this case, SQL Server converts the integer column to float, because int is lower in the hierarchy than float. It cannot use an index on large_table.int_column, although it can use an index on smalltable.float_column.
Try to avoid deadlocks
Always access tables in the same order in all your stored procedures and triggers consistently.
Keep your transactions as short as possible. Touch as few data as possible during a transaction.
Never, ever wait for user input in the middle of a transaction.
Write TSQLs using “Set based approach” rather than using “Procedural approach”
The database engine is optimized for set based SQLs. Hence, procedural approach (Use of Cursor, or, UDF to process rows in a result set) should be avoided when large result set (More than 1000) has to be processed.
How to get rid of “Procedural SQLs”? Follow these simple tricks:
-Use inline sub queries to replace User Defined Functions.
-Use correlated sub queries to replace Cursor based codes.
-If procedural coding is really necessary, at least, use a table variable Instead of a
cursor to navigate and process the result set.
Try not to use COUNT(*) to obtain the record count in the table
To get the total row count in a table, we usually use the following select statement:
Collapse
Select COUNT(*) FROM dbo.orders
This query will perform full table scan to get the row count.
The following query would not require any full table scan. (Please note that, this might not give you 100% perfect result always, but, this is handy only if you don't need a perfect count)
Collapse
Select rows FROM sysindexes
Where id = OBJECT_ID('dbo.Orders') AND indid < 2
Try to avoid dynamic SQLs
Unless really required, try to avoid the use of dynamic SQL because:
If the user provides input to the dynamic SQL, then there is possibility of SQL injection attacks.
Try to avoid the use of Temporary Tables
Unless really required, try to avoid the use of temporary tables. Rather, try to use Table variables.
Almost in 99% case, Table variables resides in memory, hence, it is a lot faster. But, Temporary tables resides in TempDb database. So, operating on Temporary table requires inter db communication and hence, slower.
Instead of LIKE search, Use Full Text Search for searching textual data
Full text search always outperforms the LIKE search.
Full text search will enable you to implement complex search criteria that can’t be implemented using the LIKE search such as searching on a single word or phrase (and optionally ranking the result set), searching on a word or phrase close to another word or phrase, or searching on synonymous forms of a specific word.
Implementing full text search is easier to implement the LIKE search (Especially, in case of complex searching requirements).
Try not to use “OR” in the query. Instead and use “UNION” to combine the result set of two distinguished queries. This will improve query performance.
(Better, use UNION ALL) if distinguished result is not required. UNION ALL is faster than UNION as it does not have to sort the result set to find out the distinguished values.
Implement a lazy loading strategy for the large objects
Store the Large Object columns (Like VARCHAR(MAX), Image Text etc) in a different table other than the main table and put a reference to the large object in the main table.
Retrieve all the main table data in the query, and, if large object is required to load, retrieve the large object data from the large object table only when this is required.
Use VARCHAR(MAX), VARBINARY(MAX) and NVARCHAR(MAX)
In SQL Server 2000, a row cannot exceed 8000 bytes in size. This limitation is due to the 8 KB internal page size SQL Server. So, to store more data in a single column, you needed to use the TEXT, NTEXT, or IMAGE data types (BLOBs) which are stored in a collection of 8 KB data pages .
These are unlike the data pages that store the other data in the same table. Rather, these pages are arranged in a B-tree structure. These data cannot be used as variables in a procedure or a function and they cannot be used inside string functions such as REPLACE, CHARINDEX or SUBSTRING. In most cases, you have to use READTEXT, WRITETEXT, and UpdateTEXT.
To solve this problem, Use VARCHAR(MAX), NVARCHAR(MAX) and VARBINARY(MAX) in SQL Server 2005. These data types can hold the same amount of data BLOBs can hold (2 GB) and they are stored in the same type of data pages used for other data types.
When data in a MAX data type exceeds 8 KB, an over-flow page is used (In the ROW_OVERFLOW allocation unit) and a pointer to the page is left in the original data page in the IN_ROW allocation unit.
Implement following good practices in User Defined Function
Do not call functions repeatedly within your stored procedures, triggers, functions and batches. For example, you might need the length of a string variable in many places of your procedure, but don't call the LEN function whenever it's needed, instead, call the LEN function once, and store the result in a variable, for later use.
Implement following good practices in Stored Procedure:
Do NOT use “SP_XXX” as a naming convention. It causes additional searches and added I/O (Because the system Stored Procedure names start with “SP_”). Using “SP_XXX” as the naming convention also increases the possibility of conflicting with an existing system stored procedure.
Use “Set Nocount On” to eliminate Extra network trip
Use WITH RECOMPILE clause in the EXECUTE statement (First time) when index structure changes (So that, the compiled version of the SP can take advantage of the newly created indexes).
Use default parameter values for easy testing.
Implement following good practices in Triggers:
Try to avoid the use of triggers. Firing a trigger and executing the triggering event is
an expensive process.
Do never use triggers that can be implemented using constraints
Do not use same trigger for different triggering events (Insert,Update,Delete)
Do not use Transactional codes inside a trigger. The trigger always runs within the
transactional scope of the code that fired the trigger.
Implement following good practices in Views:
Use views for re-using complex TSQL blocks and to enable it for Indexed views (Will be discussed later)
Use views with SCHEMABINDING option if you do not want to let users modify the table schema accidentally.
Do not use views that retrieve data from a single table only (That will be an unnecessary overhead). Use views for writing queries that access columns from multiple tables
Implement following good practices in Transactions:
Prior to SQL Server 2005, after BEGIN TRANSACTION and each subsequent modification statement, the value of @@ERROR had to be checked. If its value was non-zero then the last statement caused an error and if any error occurred, the transaction had to be rolled back and an error had to be raised (For the application). In SQL Server 2005 and onwards the Try..Catch.. block can be used to handle transactions in the TSQLs. So, try to used Try…Catch based transactional codes.
Try to avoid nested transaction. Use @@TRANCOUNT variable to determine whether Transaction needs to be started (To avoid nested transaction)
Start transaction as late as possible and commit/rollback the transaction as fast as possible to reduce the time period of resource locking.
And, that’s not the end. There are lots of best practices out there! Try finding some of them clicking on the following URL:
Remember, you need to implement the good things that you know, otherwise, you knowledge will not add any value to the system that you are going to build. Also, you need to have a process for reviewing and monitoring the codes (That are written by your team) whether the data access codes are being written following the standards and best practices.
How to analyze and identify the scope for improvement in your TSQLs?
In an ideal world, you always prevent diseases rather than cure. But, in reality you just can’t prevent always. I know your team is composed of brilliant professionals. I know you have good review process, but still bad codes are written, still poor design takes place. Why? Because, no matter what advanced technology you are going to use, your client requirement will always be way much advanced and this is a universal truth in the Software development. As a result, designing, developing and delivering a system based on the requirement will always be a challenging job for you.
So, it’s equally important that you know how to cure. You really need to know how to troubleshoot a performance problem after it happens. You need to learn the ways to analyze the TSQLs, identify the bottlenecks and re-factor those to troubleshoot the performance problem. To be true, there are numerous ways to troubleshoot database and TSQL performance problems, but, at the most basic levels, you have to understand and review the execution plan of the TSQLs that you need to analyze.
Understanding the query execution plan
Whenever you issue an SQL in the SQL Server engine, the SQL Server first has to determine the best possible way to execute it. In order to carry this out, the Query optimizer (A system that generates the optimal query execution plan before executing the query) uses several information like the data distribution statistics, index structure, metadata and other information to analyze several possible execution plans and finally selects one that is likely to be the best execution plan most of the cases.
Did you know? You can use the SQL Server Management Studio to preview and analyze the estimated execution plan for the query that you are going to issue. After writing the SQL in the SQL Server Management Studio, click on the estimated execution plan icon (See below) to see the execution plan before actually executing the query.
(Note: Alternatively, you can switch the Actual execution plan option “on” before executing the query. If you do this, the Management Studio will include the actual execution plan that is being executed along with the result set in the result window)
Figure: Estimated execution plan in Management Studio
Understanding the query execution plan in detail
Each icon in the execution plan graph represents one action item (Operator) in the plan. The execution plan has to be read from right to left and each action item has a percentage of cost relative to the total execution cost of the query (100%).
In the above execution plan graph, the first icon in the right most part represents a “Clustered Index Scan” operation (Reading all primary key index values in the table) in the HumanResources Table (That requires 100% of the total query execution cost) and the left most icon in the graph represents a Select operation (That requires only 0% of the total query execution cost).
Following are the important icons and their corresponding operators you are going to see frequently in the graphical query execution plans:
(Each icon in the graphical execution plan represents a particular action item in the query. For a complete list of the icons and their corresponding action item, go to http://technet.microsoft.com/en-us/library/ms175913.aspx )
Note the “Query cost” in the execution plan given above. It has 100% cost relative to the batch. That means, this particular query has 100% cost among all queries in the batch as there is only one query in the batch. If there were multiple queries simultaneously executed in the query window, each query would have its own percentage of cost (Less than 100%).
To know more detail for each particular action item in the query plan, move the mouse pointer on each item/icon. You will see a window that looks like the following:
This window provides detailed estimated information about a particular query item in the execution plan. The above window shows the estimated detailed information for the clustered index scan and it looks for the row(s) which have/has Gender = ‘M’ in the Employee table in HumanResources schema in the AdventureWorks database. The window also shows estimated IO, CPU number of rows with size of each row and other costs that is uses to compare with other possible execution plans to select the optimal plan.
What information do we get by viewing the execution plans?
Whenever any of your query performs slowly, you can view the estimated (And, actual if required) execution plan and can identify the item that is taking the most amount of time (In terms of percentage) in the query. When you start reviewing any TSQL for any optimization, most of the cases, the first thing you would like to do is to view the execution plan. You will most likely to quickly identify the area in the SQL that is creating the bottlenecks in the overall SQL.
Keep watching for the following costly operators in the execution plan of your query. If you find one of these, you are likely to have problems in your TSQL and you need to re-factor the TSQL to try to improve performance.
Table Scan: Occurs when the corresponding table does not have a clustered index. Most likely, creating clustered index or defragmenting indexes will enable you to get rid of it.
Clustered Index Scan: Sometimes considered equivalent to Table Scan. Takes place when non-clustered index on an eligible column is not available. Most of the cases, creating non-clustered index will enable you to get rid of it.
Hash Join: Most expensive joining methodology. This takes place when the joining columns between two tables are not indexed. Creating indexes on those columns will enable you to get rid of it.
Nested Loops: Most cases, this happens when a non-clustered index does not include (Cover) a column that is used in the Select column list. In this case, for each member in the non-clustered index column the database server has to seek into the clustered index to retrieve the other column value specified in the Select list. Creating covered index will enable you to get rid of it.
RID Lookup: Takes place when you have a non-clustered index, but, the same table does not have any clustered index. In this case, the database engine has to look up the actual row using the row ID which is an expensive operation. Creating a clustered index on the corresponding table would enable you to get rid of it.
TSQL Refactoring-A real life story
Knowledge comes into values only when applied to solve real-life problems. No matter how knowledgeable you are, you need to utilize your knowledge in an effective way in order to solve your problems.
Let’s read a real life story. In this story, Mr. Tom is one of the members of the development team that built the application that we have mentioned earlier.
When we started our optimization mission in the data access routines (TSQLs) of our application, we identified a Stored Procedure that was performing way below the expected level of performance. It was taking more than 50 seconds to process and retrieve sales data for one month for particular sales items in the production database. Following is how the stored procedure was getting invoked for retrieving sales data for ‘Caps’ for the year 2009:
Accordingly, Mr. Tom was assigned to optimize the Stored Procedure.
Following is a stored procedure that is somewhat close to the original one (I can’t include the original stored procedure for proprietary issue you know).
As a first step, Mr. Tom wanted to review the indexes of the tables that are being queried in the Stored Procedure. He had a quick look into the query and identified the fields that the tables should have indexes on (For example, fields that have been used in the join queries, Where conditions and orDER BY clause). Immediately he found that, several indexes are missing on some of these columns. For example, indexes on following two columns were missing:
OrderDetails.ProductID
OrderDetails.SalesOrderID
He created non-clustered indexes on those two columns and executed the stored procedure as follows:
Collapse
exec uspGetSalesInfoForDateRange ‘1/1/2009’, 31/12/2009 with recompile
The Stored Procedure’s performance was improved now, but still below the expected level (35 seconds). (Note the “with recompile” clause. It forces the SQL Server engine to recompile the stored procedure and re-generate the execution plan to take advantage of the newly built indexes).
Analyzing the query execution plan
Mr. Tom’s next step was to see the execution plan in the SQL Server Management Studio. He did this by writing the ‘exec’ statement for the stored procedure in the query window and viewing the “Estimated execution plan”. (The execution plan is not included here as it is quite a big one that is not going to fit in screen).
Analyzing the execution plan he identified some important scopes for improvement
A table scan was taking place on a table while executing the query even though the table has proper indexing implementation. The table scan was taking 30% of the overall query execution time.
A “Nested loop join” (One of three kinds of joining implementation) was occurring for selecting a column () from a table specified in the Select list in the query.
Being curious about the table scan issue, Mr. Tom wanted to know if any index fragmentation took place or not (Because, all indexes were properly implemented). He ran a TSQL that reports the index fragmentation information on table columns in the database (He collected this from a CodeProject article on Data access optimization) and was surprised to see that, 2 of the existing indexes (In the corresponding tables used in the TSQL in the Stored Procedure) had fragmentation that were responsible for the Table scan operation. Immediately, he defragmented those 2 indexes and found out that the table scan was not occurring and the stored procedure was taking 25 seconds now to execute.
In order to get rid of the “Nested loop join”, he implanted a “Covered index” in the corresponding table including the column in the Select list. As a result, when selecting the column, the database engine was able to retrieve the column value in the non-clustered index node. Doing this reduced the query performance up to 23 seconds now.
Implementing some best practices
Mr. Tom now decided to look for any piece of code in the stored procedure that did not conform to the best practices. Following were the changes that he did to implement some best practices:
Getting rid of the “Procedural code”
Mr. Tom identified that, a UDF ufnGetLineTotal(SalesOrderDetailID)was getting executed for each row in the result set and the UDF simply was executing another TSQL using a value in the supplied parameter and was returning a scalar value. Following was the UDF definition:
Collapse
AlterFUNCTION [dbo].[ufnGetLineTotal]
(
@SalesOrderDetailID int
)
RETURNS moneyASBEGINDECLARE @CurrentProductRate moneyDECLARE @CurrentDiscount moneyDECLARE @Qty intSelect
@CurrentProductRate = ProductRates.CurrentProductRate,
@CurrentDiscount = ProductRates.CurrentDiscount,
@Qty = orderQty
FROM
ProductRates INNERJOIN orderDetails ON
orderDetails.ProductID = ProductRates.ProductID
Where
orderDetails.SalesOrderDetailID = @SalesOrderDetailID
RETURN (@CurrentProductRate-@CurrentDiscount)*@Qty
END
This seemed to be a “Procedural approach” for calculating the order total and Mr. Tom decided to implement the UDF’s TSQL as an inline SQL in the original query. Following was the simple change that he had to implement in the stored procedure:
Collapse
dbo.ufnGetLineTotal(SalesOrderDetailID) Total -- Old Code
Collapse
(CurrentProductRate-CurrentDiscount)*OrderQty Total -- New Code
Immediately after executing the query Mr. Tom found that the query was taking 14 seconds now to execute.
Getting rid of the unnecessary Text column in the Select list
Exploring for further optimization scopes Mr. Tom decided to take a look at the column types in the Select list in the TSQL. Soon he discovered that one Text column (Products.DetailedDescription) were included in the Select list. Reviewing the application code Mr. Tom found that this column values were not being processed by the application immediately. Few columns in the result set were being displayed in a listing page in the application, and, when user clicks on a particular item in the list, a detail page was appearing containing the Text column value.
Excluding that Text column from the Select list dramatically reduced the query execution time from 14 seconds to 6 seconds! So, Mr. Tom decided to apply a “Lazy loading” strategy to load this Text column using a Stored Procedure that accepts an “ID” parameter and selects the Text column value. After implementation he found out that, the newly created Stored Procedure executes in a reasonable amount of time when user sees the detail page for an item in the item list. He also converted those two “Text” columns to “VARCHAR(MAX) columns and that enabled him to use the len() function on one of these two columns in the TSQLs in other places (That also allowed him to save some query execution time because, he was calculating the length using len(Text_Column as Varchar(8000)) in the earlier version of the code.
Optimizing further : Process of elimination
What’s next? All the optimization steps so far reduced the execution time to 6 seconds. Comparing to the execution time of 50 seconds before optimization, this is a big achievement so far. But, Mr. Tom thinks the query could have further improvement scopes. Reviewing the TSQLs Mr. Tom didn’t find any significant option left for further optimization. So, he indented and re-arranged the TSQL (So that each individual query statement (Say, Product.ProductID = orderDetail.ProductID) is written in a particular line) and starts executing the Stored Procedure again and again by commenting out each line that he suspects for having improvement scope.
Surprise! Surprise! The TSQL had some LIKE conditions (The actual Stored procedure basically performed a keyword search on some tables) for matching several patterns against some column values. When he commented out the LIKE statements, suddenly the Stored Procedure execution time jumped below 1 second. Wow!
It seemed that, having done with all the optimizations so far, the LIKE searches were taking the most amount of time in the TSQL. After carefully looking at the LIKE search conditions, Mr. Tom became pretty sure that the LIKE search based SQL could easily be implemented using the Full Text search. It seemed that two columns needed to be full text search enabled. These were: ProductName and Keyword.
It just took 5 minutes for him to implement the FTS (Creating the Full text catalog, making the two columns full text enabled and replacing the LIKE clauses with the FREETEXT function) and the query started executing now within a stunning 1 second!
Great achievement, isn’t it?
What’s next?
We’ve learned lots of things in optimizing the data access codes, but, we’ve still miles to go. Data access optimization is an endless process that gives you endless thrills and fun. No matter how big systems you have, no matter how complex your business processes are, believe me, you can make them run faster, always!
So, let’s not stop here. Let’s go through the next article in this series:
l [sys.allocation_units].type = 1,所读取的行数据,不包含text, ntext, image等类型的大型对象。
l [sys.partitions].index_id 属于0或者1 : 0表示是堆表中,1表示是集群表。
l [sys.partitions].row不为空。
由于row_count这个自定义函数需要在每一个数据库中执行,因此将权限设置为Public。
用户自定义函数row_count具体描述,见下一节。
用户自定义函数row_count()代码
具体如下:
  IFEXISTS(SelectnameFROMdbo.sysobjectsWhereid=Object_id(N'[dbo].[row_count]'))

  DropFUNCTION[dbo].[row_count]

  GO

  CreateFUNCTIONdbo.row_count(@table_namesysname)

  --@table_namewewanttogetcount

  RETURNSbigint

  AS

  BEGIN

  DECLARE@nnbigint--numberofrows

  IF@table_nameISNOTNULL

  BEGIN

  Select@nn=sum(p.rows)

  FROMsys.partitionsp

  LEFTJOINsys.allocation_unitsaONp.partition_id=a.container_id

  Where

  p.index_idin(0,1)

  andp.rowsisnotnull

  anda.type=1

  andp.object_id=object_id(@table_name)

  END

  RETURN(@nn)

  END

  GO
怎么会呢?我使用的方法也还好吧。为了能针对不同的数据库,利用DbProviderFactory创建DbConnection、DbCommand;根据CustomAttribute定义映射;利用反射将Entity的数据映射到DbCommand的Parameter上;最后执行ExecuteNonQuery。流程没有错,结果也是正确的,可为什么那么慢呢?难道是根据CustomAttribute生成CommandText和填充Parameter的速度慢?于是不执行ExecuteNonQuery,仅进行10000次InsertCommand,UpdateCommand,DeleteCommand的生成,速度很快啊。看来问题不在这里。难道是SQL语句执行效率的问题。看看我生成的Update语句,很简单“where id = @pId and version = @pVersion”。病急乱投医了,加上索引,速度还是慢。-_-b,咋回事呢?
静下心来思考了一下。以前用的方法是将实体的数据映射到DataTable,利用DbDataAdapter来完成保存操作。DataAdapter我仅提供了SelectCommand,然后就用DbCommandBuilder,很简单,效率也不错。后来觉得,既然通过Entity了,为什么我要经过DataTable来浪费资源呢?所以改为直接利用DbCommand来搞定了。对比一下二者的UpdateCommandText吧,DbCommandBuilder那个乐观并发生成的SQL语句比我的复杂多了。可它比我快!搬出SQL事件探查器,发现用DbCommmandBuilder生成的SQL语句一下刷下去一片,偶的那个可怜的一条条往下长。但这样还是没能看出个所以然来。于是狠下心,把条件改为“where id = ‘xxxx’ and version = 0”,速度那个贼快啊。可是这样写不就变得不那么通用了吗?(如:Oracle的日期是:to_date,但SQL server直接’’就好了)。再做一个尝试,将DbParameter改为SqlParameter,也不快。难道还有什么玄机?设置DbType,没有任何作用。设置了SqlDbType,终于变快了。最后得出的结论是对于SQL Server2000(其他的没有试),如果没有为SqlParameter设置SqlDbType就慢得要死。如果其他数据库也是这样,那我不是也得设置XXDbType=XX?
2 对于渲染阶段:
渲染阶段的核心是让用户尽快的看到页面的展现,能够与页面进行交互,因此重点是显示首屏的内容,让用户提早的能够看到页面,感受交互。
1 页面首屏先显示出来的话,需要将js代码的事件处理在dom树构建好之后,如同JQuery的ready事件。
2 对于html中一些默认可以不关闭的标签,尽早的关闭掉,这样也有助于提高渲染的速度。如果让浏览器去判断何时关闭才是ok的,那需要不少的回溯操作,花费不少的代价。 msdn上有详细的描述 Close Your HTML Tags
Unlike XML, HTML has the notion of implicitly closed tags. This includes frame, img, li, and p. If you don't close these tags, Internet Explorer renders your pages just fine. If you do close your tags, Internet Explorer will render your pages even faster.
3 一些大图片的延迟加载。由于浏览器并发的连接有限,对于一些大图片会被block住,所以尽量的延迟加载,或者按需加载,渲染的速度也会快一些
4 将web服务器缓冲区中的内容尽早的输出,会提浏览器开始渲染的时间。
5 页面首屏的显示尽量不要依赖于js代码。这一点很重要,这样做的话,你的一些css和js就可以延迟加载进来,而不影响首屏的展示
6 页面onload的时候可以考虑做一些预加载的事情,把一些其它页面需要用到的素材预先加载进来。搜索引擎如google,yahoo都这样做的,悄悄的加载一些大的背景图进来。
<script>
window.onload = function () {
var script = document.createElement("script");
script.src = …;
document.body.appendChild(script);
};
</script>
4 对于运行阶段:
运行阶段的核心是对js代码的优化,根据js代码的执行原理,写出高效的js代码来。
1)变量使用就近原则
js有作用域链的概念,如果本作用域找不到,就会到上一个作用域去找,如果过多的使用全局变量,就会导致每次使用变量都要去层层的检查各个作用域,性能花费不菲啊。
声明变量时记得要加上var,否则这个变量会被放到window这个顶级作用域下
不要使用with来遍历,它会阻止js执行器从本地来查找,而是遍历作用链来查找。
对于一些不得不用的全局变量,利用局部变量来缓存它
var arr = …;
var globalVar = 0;
(function () {
var i;
for (i = 0; i < arr.length; i++) {
globalVar++;
}
})();
var arr = …;
var globalVar = 0;
(function () {
var i, l, localVar;
l = arr.length;
localVar = globalVar;
for (i = 0; i < l; i++) {
localVar++;
}
globalVar = localVar;
})();
2)对于prototype链也是一样,尽量的避免prototype链的遍历
function A () {}
A.prototype.prop1 = 1;
function B () {
this.prop2 = 2;
} B.prototype = new A();
7) 能够cache的地方尽量的使用cache,尤其使一些循环中使用到的大数据集,相对稳定,又只是大量的读操作。
//没有使用缓存,每次调用都要生成v
var fn = (function () {
var b = false, v;
return function () {
if (!b) {
v = …;
b = true;
}
return v;
};
})();
//将v存储到fn中
function fn () {
if (!fn.b) {
fn.v = …;
fn.b = true;
}
return fn.v;
}
//延迟加载
var fn = function () {
var v = …;
return (fn = function () {
return v;
})();
};
8) 原语操作比函数的性能要高很多。尽量使用原语操作
//小于操作
var a = 1, b = 2, c;
c = Math.min(a, b);
c = a < b ? a : b;
//数组操作
myArray.push(value);
myArray[myArray.length] = value;
myArray[idx++] = value;
9)少在循环或者性能关键点处使用异常处理,因为异常处理需要保存不好的堆栈信息。
//循环中使用try、cache不明智
var i;
for (i = 0; i < 100000; i++) {
try {
…
} catch (e) {
…
}
}
//将try、cache提取出来
var i;
try {
for (i = 0; i < 100000; i++) {
…
}
} catch (e) {
…
}
10)性能关键点处少使用for、in,with这种操作,因为涉及到prototype链的查找
var key, value;
for (key in myArray) {
value = myArray[key];
…
}
//换成数组来操作
var i, value, length = myArray.length;
for (i = 0; i < length; i++) {
value = myArray[i];
…
}
11)在if、else的分支中如果分支一样,在外面定义它
function fn () {
if (…) {
…
} else {
…
}
}
var fn;
if (…) {
fn = function () {…};
} else {
fn = function () {…};
}
12)操作dom树的时候使用innerHtml,一次性的构造,而不是append,每次还需要调整
不过使用innerHtml也有不少的危险,比如插入script钓鱼脚本等,更多参考 The Problem With innerHTML
var i, j, el, table, tbody, row, cell;
el = document.createElement("div");
document.body.appendChild(el);
table = document.createElement("table");
el.appendChild(table);
tbody = document.createElement("tbody");
table.appendChild(tbody);
for (i = 0; i < 1000; i++) {
row = document.createElement("tr");
for (j = 0; j < 5; j++) {
cell = document.createElement("td");
row.appendChild(cell);
}
tbody.appendChild(row);
}
var i, j, el, idx, html;
idx = 0;
html = [];
html[idx++] = "
";
for (i = 0; i < 1000; i++) {
html[idx++] = "
";
for (j = 0; j < 5; j++) {
html[idx++] = "
";
}
html[idx++] = "
";
}
html[idx++] = "
";
el = document.createElement("div");
document.body.appendChild(el);
el.innerHTML = html.join("");
13) 修改dom树时尽量使用clone,而不是动态的再创建。
至少可以省去不少初始化的时间
var i, j, el, table, tbody, row, cell;
el = document.createElement("div");
document.body.appendChild(el);
table = document.createElement("table");
el.appendChild(table);
tbody = document.createElement("tbody");
table.appendChild(tbody);
for (i = 0; i < 1000; i++) {
row = document.createElement("tr");
for (j = 0; j < 5; j++) {
cell = document.createElement("td");
row.appendChild(cell);
}
tbody.appendChild(row);
}
var i, el, table, tbody, template, row, cell;
el = document.createElement("div");
document.body.appendChild(el);
table = document.createElement("table");
el.appendChild(table);
tbody = document.createElement("tbody");
table.appendChild(tbody);
template = document.createElement("tr");
for (i = 0; i < 5; i++) {
cell = document.createElement("td");
template.appendChild(cell);
}
for (i = 0; i < 1000; i++) {
row = template.cloneNode(true);
tbody.appendChild(row);
}
14)使用documentfragment
var i, j, el, table, tbody, row, cell, docFragment;
docFragment = document.createDocumentFragment();
el = document.createElement("div");
docFragment.appendChild(el);
table = document.createElement("table");
el.appendChild(table);
tbody = document.createElement("tbody");
table.appendChild(tbody);
for (i = 0; i < 1000; i++) {
…
}
document.body.appendChild(docFragment);
要较快页面的显示,光有js的优化是不够的,css也需要进行相应的优化。
css优化点:
1)css sprite合并背景图
2)js不要参与到布局中来,这样的话,在没有js的情况下页面也能够正常的显示,
就可以吧js放到后米去加载了。
3)不要使用ie的表达式,不要难过使用ie的过滤器
4) 优化table的布局,让table能够在接收到全部数居前就可以进行渲染
Use table-layout:fixed
Explicitly define a COL element for each column
Set the WIDTH attribute on each col